E-commerce Business Optimization Analysis (SQL)
A 10-section analytical deep dive into the BigQuery thelook_ecommerce dataset – examining products, brands, categories, long-term trends, seasonal patterns, customers, and distribution centers across revenue, profit, margin, return rate, and lost revenue metrics to produce actionable business recommendations.
Introduction
Project Objective
This project analyzes a large-scale e-commerce dataset to identify revenue drivers, profit optimization opportunities, return risk patterns, and operational inefficiencies – the same kinds of questions a data analyst would be asked to investigate at a real retail or e-commerce company. The framing is straightforward: if I were hired as a data analyst at this company, what would I investigate first, what would I find, and what would I recommend? Every analysis section ends with concrete, actionable business recommendations – not just charts and tables. The goal is to demonstrate that data analysis is only valuable when it translates into decisions.
Dataset Overview
The dataset used is thelook_ecommerce, a public dataset hosted in Google BigQuery (bigquery-public-data.thelook_ecommerce). It simulates a mid-size e-commerce retailer selling apparel, accessories, and outerwear – structurally analogous to real retail datasets with order statuses (Complete, Returned, Cancelled, Shipped, Processing), product costs, sale prices, customer demographics, and distribution center assignments.
Dataset at a glance:
- Scale: ~181,000 order items, ~80,000 unique customers, ~29,000 unique products across ~2,700 brands and 26 product categories
- Tables used: order_items, orders, products, users, distribution_centers, inventory_items
- Time range: 2019 through early 2026 (BigQuery continuously generates synthetic data for this dataset, so the date range extends beyond the original creation date)
- Domain: Simulated e-commerce retailer – apparel, accessories, and outerwear
Note: Because this is a synthetic/simulated dataset, some product prices contain anomalies (e.g., socks listed at $903) that would not exist in production data. These anomalies are left in the analysis as-is since the purpose is to demonstrate analytical methodology rather than clean a specific company's data.
SQL Techniques Demonstrated
The queries in this project go well beyond basic SELECT statements. Each analysis builds complex, multi-layered queries designed to extract derived metrics that do not exist in the raw data – profit margins, return rates, revenue shares, and cross-metric rankings all computed within a single query execution. The following techniques are used consistently throughout:
- Common Table Expressions (CTEs): Multi-layered CTEs (first_layer, second_layer, third_layer) used throughout to build complex metrics incrementally – separating raw aggregation, derived ratio calculations, and ranking into clean logical stages
- Window Functions: RANK(), SUM() OVER(), ROUND() with window clauses for calculating revenue shares, profit shares, and cross-metric rankings within a single query
- Conditional Aggregation: Extensive use of CASE WHEN inside SUM() and COUNT() to calculate status-specific metrics (revenue from completed orders only, return counts, cancellation counts, en-route counts) from a single pass through the data
- Multi-table JOINs: Consistently joining order_items → orders → products (and users, distribution_centers, inventory_items where relevant) to build unified analytical views
- NULLIF for safe division: Used throughout to prevent division-by-zero errors in ratio calculations (profit margin, return rate, completion rate, etc.)
- DATE functions: DATE_TRUNC, EXTRACT(MONTH FROM ...), DATE_DIFF for time-series aggregation and customer lifetime calculations
- Subquery filtering: Third-layer CTEs with WHERE clauses filtering on rank thresholds (e.g., WHERE revenue_rank <= 50) to create contextually meaningful "bottom" analyses rather than simply reversing sort order
Every query is written to be readable and self-documenting – clear aliasing, logical CTE naming, and consistent formatting throughout.
Analysis Structure
The analysis is structured across ten analytical dimensions: Top Products, Bottom Products, Top Brands, Bottom Brands, Top Categories, Bottom Categories, Long Term Trends, Seasonal Trends, Customers, and Distribution Centers. Each section examines performance from multiple angles – revenue, profit, profit margin, unit volume, return rate, units returned, lost revenue, and lost profit – providing a 360-degree view rather than a single-metric snapshot.
"Top" and "Bottom" analyses are paired intentionally. Understanding what performs well is only half the picture – identifying underperformers, high-risk products, and margin-compressing segments is equally valuable for business optimization. A company that only monitors its best sellers will miss the products, brands, and categories that are quietly eroding profitability through returns, cancellations, and thin margins.
Every section concludes with an Analytical Insights & Business Recommendations block that translates data findings into specific, prioritized actions a business could take.
Business Context
E-commerce businesses generate massive transactional datasets but often lack the analytical infrastructure to extract cross-dimensional insights – most reporting stops at top-line revenue. This project goes deeper: it examines where profit is actually generated vs. where revenue is highest (they often diverge), which products and brands are net-negative after accounting for returns and cancellations, and what operational patterns (distribution center inventory imbalances, seasonal demand shifts) are costing the business money.
SQL is the foundational tool for this kind of work because the questions require joining multiple tables, filtering on complex conditions, and computing derived metrics that don't exist in raw data – exactly the workflow a data analyst performs daily. The retail and e-commerce industry context is important here: return rates of 20–30% are common in online apparel retail. The ~28% average return rate observed in this dataset is realistic and aligns with industry benchmarks, which validates the analytical approach.
Key Metrics Tracked
The following metrics are computed and referenced throughout every section of the analysis. Understanding these definitions is essential for interpreting the tables and recommendations.
- Revenue: Sum of sale prices from completed orders only
- Profit: Revenue minus product cost for completed orders
- Profit Margin: Profit / Revenue – measures how much of each revenue dollar is retained
- Return Rate: Returned items / (Completed + Returned items) – measures post-delivery dissatisfaction
- Completion Rate: Completed items / (Total items − Cancelled items) – measures fulfillment success
- Cancellation Rate: Cancelled items / Total items ordered
- En Route Rate: Shipped + Processing items / (Total − Cancelled − Returned) – measures what share of surviving orders are still in transit
- Lost Revenue / Lost Profit: Revenue and profit that would have been earned if returned and cancelled orders had completed – quantifies the business cost of failed orders
- Revenue Share / Profit Share / Unit Orders Share: Each entity's contribution to total business volume – enables apples-to-apples comparison across different scales
Top Products
Top products by Revenue
WITH first_layer AS (
SELECT
  p.name AS product_name,
  p.brand AS product_brand,
  p.category AS product_category,
  ROUND(AVG(oi.sale_price), 2) AS avg_product_sale_price,
  ROUND(AVG(p.cost), 2) AS avg_product_cost,
ROUND(SUM(CASE WHEN oi.status = 'Complete' THEN oi.sale_price ELSE 0 END), 2) AS
revenue,
ROUND(SUM(CASE WHEN oi.status = 'Complete' THEN (oi.sale_price - p.cost) ELSE 0
END), 2) AS profit,
COUNT(*) AS unit_orders_placed,
SUM(CASE WHEN oi.status = 'Complete' THEN 1 ELSE 0 END) AS units_completed,
SUM(CASE WHEN oi.status = 'Returned' THEN 1 ELSE 0 END) AS units_returned,
SUM(CASE WHEN oi.status = 'Cancelled' THEN 1 ELSE 0 END) AS units_cancelled,
SUM(CASE WHEN oi.status IN ('Shipped', 'Processing') THEN 1 ELSE 0 END) AS units_en_route,
ROUND(SUM(CASE WHEN oi.status IN ('Returned', 'Cancelled') THEN oi.sale_price ELSE 0 END), 2) AS lost_revenue,
ROUND(SUM(CASE WHEN oi.status IN ('Returned', 'Cancelled') THEN (oi.sale_price - p.cost) ELSE 0 END), 2) AS lost_profit
FROM `bigquery-public-data.thelook_ecommerce.order_items` AS oi
JOIN `bigquery-public-data.thelook_ecommerce.orders` AS o
ON oi.order_id = o.order_id
JOIN `bigquery-public-data.thelook_ecommerce.products` AS p
ON oi.product_id = p.id
GROUP BY product_name, product_brand, product_category
),
second_layer AS (
SELECT
  *,
  ROUND((profit / NULLIF(revenue, 0)), 4) AS profit_margin,
  ROUND(units_returned / NULLIF(units_completed + units_returned, 0), 4) AS return_rate,
  ROUND(units_completed / NULLIF(unit_orders_placed - units_cancelled, 0), 4) AS completion_rate,
  ROUND(units_cancelled / NULLIF(unit_orders_placed, 0), 4) AS cancellation_rate,
  ROUND(units_en_route / NULLIF(unit_orders_placed - (units_cancelled + units_returned), 0), 4) AS en_route_rate,
  ROUND(revenue / SUM(revenue) OVER(), 7) AS revenue_share,
  ROUND(profit / SUM(profit) OVER(), 7) AS profit_share,
  ROUND(unit_orders_placed / SUM(unit_orders_placed) OVER(), 7) AS unit_orders_placed_share
FROM first_layer
)
SELECT
  *,
  RANK() OVER(ORDER BY avg_product_sale_price DESC) AS avg_product_sale_price_rank,
  RANK() OVER(ORDER BY avg_product_cost DESC) AS avg_product_cost_rank,
  RANK() OVER(ORDER BY revenue DESC) AS revenue_rank,
  RANK() OVER(ORDER BY profit DESC) AS profit_rank,
  RANK() OVER(ORDER BY unit_orders_placed DESC) AS unit_orders_placed_rank,
  RANK() OVER(ORDER BY units_completed DESC) AS units_completed_rank,
  RANK() OVER(ORDER BY units_returned DESC) AS units_returned_rank,
  RANK() OVER(ORDER BY units_cancelled DESC) AS units_cancelled_rank,
  RANK() OVER(ORDER BY units_en_route DESC) AS units_en_route_rank,
  RANK() OVER(ORDER BY lost_revenue DESC) AS lost_revenue_rank,
  RANK() OVER(ORDER BY lost_profit DESC) AS lost_profit_rank,
  RANK() OVER(ORDER BY profit_margin DESC) AS profit_margin_rank,
  RANK() OVER(ORDER BY return_rate DESC) AS return_rate_rank,
  RANK() OVER(ORDER BY completion_rate DESC) AS completion_rate_rank,
  RANK() OVER(ORDER BY cancellation_rate DESC) AS cancellation_rate_rank,
  RANK() OVER(ORDER BY en_route_rate DESC) AS en_route_rate_rank
FROM second_layer
ORDER BY
  revenue_rank ASC
LIMIT 15;| product_name | product_brand | product_category | avg_product_sale_price | avg_product_cost | revenue | profit | unit_orders_placed | units_completed | units_returned | units_cancelled | units_en_route | lost_revenue | lost_profit | profit_margin | return_rate | completion_rate | cancellation_rate | en_route_rate | revenue_share | profit_share | unit_orders_placed_share | avg_product_sale_price_rank | avg_product_cost_rank | revenue_rank | profit_rank | unit_orders_placed_rank | units_completed_rank | units_returned_rank | units_cancelled_rank | units_en_route_rank | lost_revenue_rank | lost_profit_rank | profit_margin_rank | return_rate_rank | completion_rate_rank | cancellation_rate_rank | en_route_rate_rank |
|---|---|---|---|---|---|---|---|---|---|---|---|---|---|---|---|---|---|---|---|---|---|---|---|---|---|---|---|---|---|---|---|---|---|---|---|---|---|
| ASCIS Cushion Low Socks (Pack of 3) | ASICS | Active | 903.0 | 373.84 | 3612.0 | 2116.63 | 11 | 4 | 0 | 1 | 6 | 903.0 | 529.16 | 0.586 | 0.0 | 0.4 | 0.0909 | 0.6 | 0.001338 | 0.0015127 | 6.07e-05 | 5 | 28 | 1 | 1 | 1161 | 776 | 13463 | 7029 | 1398 | 155 | 142 | 3719 | 13463 | 7482 | 16872 | 16953 |
| The North Face Women's S-XL Oso Jacket | The North Face | Outerwear & Coats | 903.0 | 378.36 | 3612.0 | 2098.57 | 10 | 4 | 1 | 1 | 4 | 1806.0 | 1049.29 | 0.581 | 0.2 | 0.4444 | 0.1 | 0.5 | 0.001338 | 0.0014998 | 5.52e-05 | 5 | 25 | 1 | 2 | 1962 | 776 | 3978 | 7029 | 6105 | 22 | 24 | 4209 | 12637 | 6492 | 16366 | 19501 |
| Spyder Women's Jesst In Time Jacket | Spyder | Outerwear & Coats | 650.0 | 295.75 | 3250.0 | 1771.25 | 10 | 5 | 4 | 0 | 1 | 2600.0 | 1417.0 | 0.545 | 0.4444 | 0.5 | 0.0 | 0.1667 | 0.0012039 | 0.0012659 | 5.52e-05 | 52 | 50 | 3 | 4 | 1962 | 251 | 30 | 17458 | 23197 | 7 | 7 | 8121 | 8264 | 3269 | 17458 | 27059 |
| Bergama Natural Raccoon Hooded Stroller - - Multicolor | Bergama | Outerwear & Coats | 749.99 | 306.75 | 2999.96 | 1772.98 | 10 | 4 | 1 | 0 | 5 | 749.99 | 443.24 | 0.591 | 0.2 | 0.4 | 0.0 | 0.5556 | 0.0011113 | 0.0012671 | 5.52e-05 | 40 | 43 | 4 | 3 | 1962 | 776 | 3978 | 17458 | 3026 | 267 | 224 | 3279 | 12637 | 7482 | 17458 | 19270 |
| Woolrich Arctic Parka DF | Woolrich | Outerwear & Coats | 990.0 | 478.17 | 2970.0 | 1535.49 | 12 | 3 | 2 | 1 | 6 | 2970.0 | 1535.49 | 0.517 | 0.4 | 0.2727 | 0.0833 | 0.6667 | 0.0011002 | 0.0010974 | 6.62e-05 | 3 | 6 | 5 | 6 | 694 | 2358 | 844 | 7029 | 1398 | 4 | 4 | 10735 | 8312 | 14284 | 17144 | 12990 |
| Joseph Abboud Men's Two-button Side Vent Sport Coat | Joseph Abboud | Suits & Sport Coats | 264.0 | 101.9 | 2904.0 | 1759.82 | 30 | 11 | 2 | 2 | 15 | 1056.0 | 656.57 | 0.606 | 0.1538 | 0.3929 | 0.0667 | 0.5769 | 0.0010758 | 0.0012577 | 0.0001655 | 430 | 734 | 6 | 5 | 7 | 3 | 844 | 2100 | 11 | 112 | 91 | 2144 | 13388 | 9081 | 17408 | 18610 |
| AIR JORDAN DOMINATE SHORTS MENS 465071-100 | Jordan | Shorts | 903.0 | 454.21 | 2709.0 | 1346.37 | 5 | 3 | 0 | 0 | 2 | 0.0 | 0.0 | 0.497 | 0.0 | 0.6 | 0.0 | 0.4 | 0.0010035 | 0.0009622 | 2.76e-05 | 5 | 8 | 7 | 9 | 16887 | 2358 | 13463 | 17458 | 17069 | 22642 | 22642 | 12874 | 13463 | 2189 | 17458 | 23875 |
| The North Face Denali Down Mens Jacket 2013 | The North Face | Outerwear & Coats | 903.0 | 436.15 | 2709.0 | 1400.55 | 13 | 3 | 2 | 2 | 6 | 3612.0 | 1867.4 | 0.517 | 0.4 | 0.2727 | 0.1538 | 0.6667 | 0.0010035 | 0.001001 | 7.17e-05 | 5 | 10 | 7 | 7 | 423 | 2358 | 844 | 2100 | 1398 | 2 | 3 | 10735 | 8312 | 14284 | 12634 | 12990 |
| Diesel Men's Lagnum Leather Jacket | Diesel | Outerwear & Coats | 598.0 | 267.9 | 2392.0 | 1320.38 | 7 | 4 | 1 | 1 | 1 | 1196.0 | 660.19 | 0.552 | 0.2 | 0.6667 | 0.1429 | 0.2 | 0.0008861 | 0.0009437 | 3.86e-05 | 57 | 56 | 9 | 10 | 8625 | 776 | 3978 | 7029 | 23197 | 92 | 89 | 7373 | 12637 | 1185 | 12706 | 26859 |
| Nobis Merideth Parka | Nobis | Outerwear & Coats | 795.0 | 382.39 | 2385.0 | 1237.82 | 7 | 3 | 1 | 1 | 2 | 1590.0 | 825.21 | 0.519 | 0.25 | 0.5 | 0.1429 | 0.4 | 0.0008835 | 0.0008847 | 3.86e-05 | 33 | 23 | 10 | 12 | 8625 | 2358 | 3978 | 7029 | 17069 | 37 | 45 | 10485 | 11344 | 3269 | 12706 | 23875 |
| Canada Goose Women's Expedition Parka | Canada Goose | Outerwear & Coats | 795.0 | 395.91 | 2385.0 | 1197.27 | 4 | 3 | 0 | 1 | 0 | 795.0 | 399.09 | 0.502 | 0.0 | 1.0 | 0.25 | 0.0 | 0.0008835 | 0.0008557 | 2.21e-05 | 33 | 19 | 10 | 13 | 21053 | 2358 | 13463 | 7029 | 27145 | 230 | 277 | 12357 | 13463 | 1 | 5542 | 27145 |
| Men's Classic Sheepskin B-3 Bomber Jacket | Overland Sheepskin Co | Outerwear & Coats | 595.0 | 270.73 | 2380.0 | 1297.1 | 13 | 4 | 0 | 2 | 7 | 1190.0 | 648.55 | 0.545 | 0.0 | 0.3636 | 0.1538 | 0.6364 | 0.0008816 | 0.000927 | 7.17e-05 | 60 | 55 | 12 | 11 | 423 | 776 | 13463 | 2100 | 623 | 95 | 94 | 8121 | 13463 | 9638 | 12634 | 16487 |
| Michael Kors Men's Marlow Wool-Blend Single-Breasted Fitted Top Coat | Michael Kors | Outerwear & Coats | 255.0 | 102.26 | 2295.0 | 1374.7 | 15 | 9 | 1 | 2 | 3 | 765.0 | 458.23 | 0.599 | 0.1 | 0.6923 | 0.1333 | 0.25 | 0.0008502 | 0.0009825 | 8.27e-05 | 469 | 728 | 13 | 8 | 187 | 5 | 3978 | 2100 | 10869 | 252 | 208 | 2612 | 13461 | 1184 | 14317 | 26348 |
| Barbour Sapper Jacket | Barbour | Outerwear & Coats | 429.0 | 210.21 | 2145.0 | 1093.95 | 10 | 5 | 1 | 1 | 3 | 858.0 | 437.58 | 0.51 | 0.1667 | 0.5556 | 0.1 | 0.375 | 0.0007946 | 0.0007818 | 5.52e-05 | 94 | 81 | 14 | 18 | 1962 | 251 | 3978 | 7029 | 10869 | 185 | 233 | 11510 | 13196 | 3151 | 16366 | 24717 |
| Arc'teryx Moray Jacket - Women's | Arc'teryx | Outerwear & Coats | 699.0 | 343.91 | 2097.0 | 1065.28 | 9 | 3 | 0 | 3 | 3 | 2097.0 | 1065.28 | 0.508 | 0.0 | 0.5 | 0.3333 | 0.5 | 0.0007768 | 0.0007613 | 4.96e-05 | 41 | 36 | 15 | 20 | 3355 | 2358 | 13463 | 526 | 10869 | 11 | 22 | 11720 | 13463 | 3269 | 2619 | 19501 |
Top products by Profit Margin
WITH first_layer AS (
SELECT
  p.name AS product_name,
  p.brand AS product_brand,
  p.category AS product_category,
  ROUND(AVG(oi.sale_price), 2) AS avg_product_sale_price,
  ROUND(AVG(p.cost), 2) AS avg_product_cost,
ROUND(SUM(CASE WHEN oi.status = 'Complete' THEN oi.sale_price ELSE 0 END), 2) AS
revenue,
ROUND(SUM(CASE WHEN oi.status = 'Complete' THEN (oi.sale_price - p.cost) ELSE 0
END), 2) AS profit,
COUNT(*) AS unit_orders_placed,
SUM(CASE WHEN oi.status = 'Complete' THEN 1 ELSE 0 END) AS units_completed,
SUM(CASE WHEN oi.status = 'Returned' THEN 1 ELSE 0 END) AS units_returned,
SUM(CASE WHEN oi.status = 'Cancelled' THEN 1 ELSE 0 END) AS units_cancelled,
SUM(CASE WHEN oi.status IN ('Shipped', 'Processing') THEN 1 ELSE 0 END) AS units_en_route,
ROUND(SUM(CASE WHEN oi.status IN ('Returned', 'Cancelled') THEN oi.sale_price ELSE 0 END), 2) AS lost_revenue,
ROUND(SUM(CASE WHEN oi.status IN ('Returned', 'Cancelled') THEN (oi.sale_price - p.cost) ELSE 0 END), 2) AS lost_profit
FROM `bigquery-public-data.thelook_ecommerce.order_items` AS oi
JOIN `bigquery-public-data.thelook_ecommerce.orders` AS o
ON oi.order_id = o.order_id
JOIN `bigquery-public-data.thelook_ecommerce.products` AS p
ON oi.product_id = p.id
GROUP BY product_name, product_brand, product_category
),
second_layer AS (
SELECT
  *,
  ROUND((profit / NULLIF(revenue, 0)), 4) AS profit_margin,
  ROUND(units_returned / NULLIF(units_completed + units_returned, 0), 4) AS return_rate,
  ROUND(units_completed / NULLIF(unit_orders_placed - units_cancelled, 0), 4) AS completion_rate,
  ROUND(units_cancelled / NULLIF(unit_orders_placed, 0), 4) AS cancellation_rate,
  ROUND(units_en_route / NULLIF(unit_orders_placed - (units_cancelled + units_returned), 0), 4) AS en_route_rate,
  ROUND(revenue / SUM(revenue) OVER(), 7) AS revenue_share,
  ROUND(profit / SUM(profit) OVER(), 7) AS profit_share,
  ROUND(unit_orders_placed / SUM(unit_orders_placed) OVER(), 7) AS unit_orders_placed_share
FROM first_layer
)
SELECT
  *,
  RANK() OVER(ORDER BY avg_product_sale_price DESC) AS avg_product_sale_price_rank,
  RANK() OVER(ORDER BY avg_product_cost DESC) AS avg_product_cost_rank,
  RANK() OVER(ORDER BY revenue DESC) AS revenue_rank,
  RANK() OVER(ORDER BY profit DESC) AS profit_rank,
  RANK() OVER(ORDER BY unit_orders_placed DESC) AS unit_orders_placed_rank,
  RANK() OVER(ORDER BY units_completed DESC) AS units_completed_rank,
  RANK() OVER(ORDER BY units_returned DESC) AS units_returned_rank,
  RANK() OVER(ORDER BY units_cancelled DESC) AS units_cancelled_rank,
  RANK() OVER(ORDER BY units_en_route DESC) AS units_en_route_rank,
  RANK() OVER(ORDER BY lost_revenue DESC) AS lost_revenue_rank,
  RANK() OVER(ORDER BY lost_profit DESC) AS lost_profit_rank,
  RANK() OVER(ORDER BY profit_margin DESC) AS profit_margin_rank,
  RANK() OVER(ORDER BY return_rate DESC) AS return_rate_rank,
  RANK() OVER(ORDER BY completion_rate DESC) AS completion_rate_rank,
  RANK() OVER(ORDER BY cancellation_rate DESC) AS cancellation_rate_rank,
  RANK() OVER(ORDER BY en_route_rate DESC) AS en_route_rate_rank
FROM second_layer
ORDER BY
  profit_margin_rank ASC
LIMIT 15;| product_name | product_brand | product_category | avg_product_sale_price | avg_product_cost | revenue | profit | unit_orders_placed | units_completed | units_returned | units_cancelled | units_en_route | lost_revenue | lost_profit | profit_margin | return_rate | completion_rate | cancellation_rate | en_route_rate | revenue_share | profit_share | unit_orders_placed_share | avg_product_sale_price_rank | avg_product_cost_rank | revenue_rank | profit_rank | unit_orders_placed_rank | units_completed_rank | units_returned_rank | units_cancelled_rank | units_en_route_rank | lost_revenue_rank | lost_profit_rank | profit_margin_rank | return_rate_rank | completion_rate_rank | cancellation_rate_rank | en_route_rate_rank |
|---|---|---|---|---|---|---|---|---|---|---|---|---|---|---|---|---|---|---|---|---|---|---|---|---|---|---|---|---|---|---|---|---|---|---|---|---|---|
| Plus Size Black Jazzy Jacket | Fashion Love | Blazers & Jackets | 34.99 | 11.58 | 104.97 | 70.22 | 5 | 3 | 0 | 1 | 1 | 34.99 | 23.41 | 0.669 | 0.0 | 0.75 | 0.2 | 0.25 | 3.89e-05 | 5.02e-05 | 2.76e-05 | 15963 | 20949 | 7698 | 5726 | 16887 | 2358 | 13463 | 7029 | 23197 | 17236 | 14884 | 1 | 13463 | 746 | 8435 | 26348 |
| Ulla Popken Plus Size Soutache Embroidered Jacket | Ulla Popken | Blazers & Jackets | 89.0 | 29.46 | 178.0 | 119.08 | 7 | 2 | 1 | 0 | 4 | 89.0 | 59.54 | 0.669 | 0.3333 | 0.2857 | 0.0 | 0.6667 | 6.59e-05 | 8.51e-05 | 3.86e-05 | 4994 | 8857 | 4102 | 2773 | 8625 | 6114 | 3978 | 17458 | 6105 | 9306 | 6919 | 1 | 8752 | 13238 | 17458 | 12990 |
| Ted Baker Women's Mowna | Ted Baker | Blazers & Jackets | 206.96 | 68.5 | 206.96 | 138.46 | 7 | 1 | 1 | 1 | 4 | 413.92 | 276.91 | 0.669 | 0.5 | 0.1667 | 0.1429 | 0.8 | 7.67e-05 | 9.9e-05 | 3.86e-05 | 771 | 2149 | 3223 | 2200 | 8625 | 13264 | 3978 | 7029 | 6105 | 925 | 621 | 1 | 4275 | 19436 | 12706 | 7598 |
| Eddie Bauer Signature Stretch Blazer | Eddie Bauer | Blazers & Jackets | 149.95 | 49.63 | 299.9 | 200.63 | 9 | 2 | 0 | 2 | 5 | 299.9 | 200.63 | 0.669 | 0.0 | 0.2857 | 0.2222 | 0.7143 | 0.0001111 | 0.0001434 | 4.96e-05 | 1956 | 3876 | 1775 | 1137 | 3355 | 6114 | 13463 | 2100 | 3026 | 1734 | 1126 | 1 | 13463 | 13238 | 7837 | 12035 |
| DKNYC Women's 2 Button Blazer | DKNYC | Blazers & Jackets | 99.09 | 32.8 | 198.18 | 132.58 | 6 | 2 | 2 | 0 | 2 | 198.18 | 132.58 | 0.669 | 0.5 | 0.3333 | 0.0 | 0.5 | 7.34e-05 | 9.48e-05 | 3.31e-05 | 4110 | 7591 | 3450 | 2363 | 12532 | 6114 | 844 | 17458 | 17069 | 3375 | 2320 | 1 | 4275 | 9747 | 17458 | 19501 |
| Allegra K Front Opening Long Sleeve Womenwear Form-fitting Blazer Off White XS | Allegra K | Blazers & Jackets | 18.68 | 6.18 | 37.36 | 24.99 | 6 | 2 | 0 | 1 | 3 | 18.68 | 12.5 | 0.6689 | 0.0 | 0.4 | 0.1667 | 0.6 | 1.38e-05 | 1.79e-05 | 3.31e-05 | 23425 | 25885 | 16627 | 14250 | 12532 | 6114 | 13463 | 7029 | 10869 | 20771 | 19355 | 6 | 13463 | 7482 | 10731 | 16953 |
| Allegra K Women Horizontal Stripes Bubble Sleeve Spring Coat Black XS | Allegra K | Blazers & Jackets | 11.67 | 3.86 | 23.34 | 15.61 | 10 | 2 | 1 | 0 | 7 | 11.67 | 7.81 | 0.6688 | 0.3333 | 0.2 | 0.0 | 0.7778 | 8.6e-06 | 1.12e-05 | 5.52e-05 | 26523 | 27736 | 19737 | 17784 | 1962 | 6114 | 3978 | 17458 | 623 | 21976 | 21271 | 7 | 8752 | 17510 | 17458 | 9281 |
| BB Dakota Yellow Marigold Naples Boxy Cropped Blazer Button up Front and Double Pockets | BB Dakota | Blazers & Jackets | 77.0 | 25.56 | 77.0 | 51.44 | 6 | 1 | 0 | 2 | 3 | 154.0 | 102.87 | 0.6681 | 0.0 | 0.25 | 0.3333 | 0.75 | 2.85e-05 | 3.68e-05 | 3.31e-05 | 6222 | 10673 | 10392 | 8077 | 12532 | 13264 | 13463 | 2100 | 10869 | 4944 | 3344 | 8 | 13463 | 14408 | 2619 | 9487 |
| Mango Women's Suit Cropped Blazer - Chipi | MANGO | Blazers & Jackets | 49.99 | 16.6 | 99.98 | 66.79 | 4 | 2 | 1 | 0 | 1 | 49.99 | 33.39 | 0.668 | 0.3333 | 0.5 | 0.0 | 0.3333 | 3.7e-05 | 4.77e-05 | 2.21e-05 | 10894 | 16411 | 8109 | 6088 | 21053 | 6114 | 3978 | 17458 | 23197 | 14347 | 11779 | 9 | 8752 | 3269 | 17458 | 24854 |
| Calvin Klein Jeans Women's Moto Jacket | Calvin Klein Jeans | Blazers & Jackets | 56.39 | 18.72 | 56.39 | 37.67 | 5 | 1 | 1 | 0 | 3 | 56.39 | 37.67 | 0.668 | 0.5 | 0.2 | 0.0 | 0.75 | 2.09e-05 | 2.69e-05 | 2.76e-05 | 9503 | 14790 | 13133 | 10707 | 16887 | 13264 | 3978 | 17458 | 10869 | 13238 | 10778 | 9 | 4275 | 17510 | 17458 | 9487 |
| Allegra K Women Double Breasted Long Sleeve Autumn Blazer Coat Army Green XS | Allegra K | Blazers & Jackets | 16.05 | 5.33 | 32.1 | 21.44 | 4 | 2 | 0 | 1 | 1 | 16.05 | 10.72 | 0.6679 | 0.0 | 0.6667 | 0.25 | 0.3333 | 1.19e-05 | 1.53e-05 | 2.21e-05 | 24296 | 26673 | 17542 | 15499 | 21053 | 6114 | 13463 | 7029 | 23197 | 21164 | 20129 | 11 | 13463 | 1185 | 5542 | 24854 |
| Pendleton Women's Trimmed Herringbone Blazer | Pendleton | Blazers & Jackets | 258.0 | 85.91 | 516.0 | 344.17 | 6 | 2 | 1 | 2 | 1 | 774.0 | 516.26 | 0.667 | 0.3333 | 0.5 | 0.3333 | 0.3333 | 0.0001911 | 0.000246 | 3.31e-05 | 462 | 1282 | 594 | 364 | 12532 | 6114 | 3978 | 2100 | 23197 | 251 | 153 | 12 | 8752 | 3269 | 2619 | 24854 |
| Corey Lynn Calter Women's Jessica Jacket | CoreyLynnCalter | Blazers & Jackets | 79.0 | 26.31 | 79.0 | 52.69 | 3 | 1 | 0 | 1 | 1 | 79.0 | 52.69 | 0.667 | 0.0 | 0.5 | 0.3333 | 0.5 | 2.93e-05 | 3.77e-05 | 1.65e-05 | 5951 | 10284 | 10194 | 7889 | 24645 | 13264 | 13463 | 7029 | 23197 | 10287 | 7953 | 12 | 13463 | 3269 | 2619 | 19501 |
| Only Hearts Women's Double Knit 2 Button Jacket | Only Hearts | Blazers & Jackets | 185.0 | 61.61 | 1110.0 | 740.37 | 11 | 6 | 0 | 0 | 5 | 0.0 | 0.0 | 0.667 | 0.0 | 0.5455 | 0.0 | 0.4545 | 0.0004112 | 0.0005291 | 6.07e-05 | 1114 | 2672 | 94 | 56 | 1161 | 84 | 13463 | 17458 | 3026 | 22642 | 22642 | 12 | 13463 | 3246 | 17458 | 23452 |
| Plus Size White Night Sky Top | Alex Evenings | Blazers & Jackets | 124.99 | 41.62 | 124.99 | 83.37 | 4 | 1 | 2 | 0 | 1 | 249.98 | 166.74 | 0.667 | 0.6667 | 0.25 | 0.0 | 0.5 | 4.63e-05 | 5.96e-05 | 2.21e-05 | 2939 | 5153 | 6403 | 4593 | 21053 | 13264 | 844 | 17458 | 23197 | 2385 | 1545 | 12 | 3055 | 14408 | 17458 | 19501 |
Top products by Lost Revenue
WITH first_layer AS (
SELECT
  p.name AS product_name,
  p.brand AS product_brand,
  p.category AS product_category,
  ROUND(AVG(oi.sale_price), 2) AS avg_product_sale_price,
  ROUND(AVG(p.cost), 2) AS avg_product_cost,
ROUND(SUM(CASE WHEN oi.status = 'Complete' THEN oi.sale_price ELSE 0 END), 2) AS
revenue,
ROUND(SUM(CASE WHEN oi.status = 'Complete' THEN (oi.sale_price - p.cost) ELSE 0
END), 2) AS profit,
COUNT(*) AS unit_orders_placed,
SUM(CASE WHEN oi.status = 'Complete' THEN 1 ELSE 0 END) AS units_completed,
SUM(CASE WHEN oi.status = 'Returned' THEN 1 ELSE 0 END) AS units_returned,
SUM(CASE WHEN oi.status = 'Cancelled' THEN 1 ELSE 0 END) AS units_cancelled,
SUM(CASE WHEN oi.status IN ('Shipped', 'Processing') THEN 1 ELSE 0 END) AS units_en_route,
ROUND(SUM(CASE WHEN oi.status IN ('Returned', 'Cancelled') THEN oi.sale_price ELSE 0 END), 2) AS lost_revenue,
ROUND(SUM(CASE WHEN oi.status IN ('Returned', 'Cancelled') THEN (oi.sale_price - p.cost) ELSE 0 END), 2) AS lost_profit
FROM `bigquery-public-data.thelook_ecommerce.order_items` AS oi
JOIN `bigquery-public-data.thelook_ecommerce.orders` AS o
ON oi.order_id = o.order_id
JOIN `bigquery-public-data.thelook_ecommerce.products` AS p
ON oi.product_id = p.id
GROUP BY product_name, product_brand, product_category
),
second_layer AS (
SELECT
  *,
  ROUND((profit / NULLIF(revenue, 0)), 4) AS profit_margin,
  ROUND(units_returned / NULLIF(units_completed + units_returned, 0), 4) AS return_rate,
  ROUND(units_completed / NULLIF(unit_orders_placed - units_cancelled, 0), 4) AS completion_rate,
  ROUND(units_cancelled / NULLIF(unit_orders_placed, 0), 4) AS cancellation_rate,
  ROUND(units_en_route / NULLIF(unit_orders_placed - (units_cancelled + units_returned), 0), 4) AS en_route_rate,
  ROUND(revenue / SUM(revenue) OVER(), 7) AS revenue_share,
  ROUND(profit / SUM(profit) OVER(), 7) AS profit_share,
  ROUND(unit_orders_placed / SUM(unit_orders_placed) OVER(), 7) AS unit_orders_placed_share
FROM first_layer
)
SELECT
  *,
  RANK() OVER(ORDER BY avg_product_sale_price DESC) AS avg_product_sale_price_rank,
  RANK() OVER(ORDER BY avg_product_cost DESC) AS avg_product_cost_rank,
  RANK() OVER(ORDER BY revenue DESC) AS revenue_rank,
  RANK() OVER(ORDER BY profit DESC) AS profit_rank,
  RANK() OVER(ORDER BY unit_orders_placed DESC) AS unit_orders_placed_rank,
  RANK() OVER(ORDER BY units_completed DESC) AS units_completed_rank,
  RANK() OVER(ORDER BY units_returned DESC) AS units_returned_rank,
  RANK() OVER(ORDER BY units_cancelled DESC) AS units_cancelled_rank,
  RANK() OVER(ORDER BY units_en_route DESC) AS units_en_route_rank,
  RANK() OVER(ORDER BY lost_revenue DESC) AS lost_revenue_rank,
  RANK() OVER(ORDER BY lost_profit DESC) AS lost_profit_rank,
  RANK() OVER(ORDER BY profit_margin DESC) AS profit_margin_rank,
  RANK() OVER(ORDER BY return_rate DESC) AS return_rate_rank,
  RANK() OVER(ORDER BY completion_rate DESC) AS completion_rate_rank,
  RANK() OVER(ORDER BY cancellation_rate DESC) AS cancellation_rate_rank,
  RANK() OVER(ORDER BY en_route_rate DESC) AS en_route_rate_rank
FROM second_layer
ORDER BY
  lost_revenue_rank ASC
LIMIT 15;| product_name | product_brand | product_category | avg_product_sale_price | avg_product_cost | revenue | profit | unit_orders_placed | units_completed | units_returned | units_cancelled | units_en_route | lost_revenue | lost_profit | profit_margin | return_rate | completion_rate | cancellation_rate | en_route_rate | revenue_share | profit_share | unit_orders_placed_share | avg_product_sale_price_rank | avg_product_cost_rank | revenue_rank | profit_rank | unit_orders_placed_rank | units_completed_rank | units_returned_rank | units_cancelled_rank | units_en_route_rank | lost_revenue_rank | lost_profit_rank | profit_margin_rank | return_rate_rank | completion_rate_rank | cancellation_rate_rank | en_route_rate_rank |
|---|---|---|---|---|---|---|---|---|---|---|---|---|---|---|---|---|---|---|---|---|---|---|---|---|---|---|---|---|---|---|---|---|---|---|---|---|---|
| Canada Goose Men's The Chateau Jacket | Canada Goose | Active | 815.0 | 337.41 | 0.0 | 0.0 | 6 | 0 | 1 | 4 | 1 | 4075.0 | 2387.95 | 1.0 | 0.0 | 0.6667 | 1.0 | 0.0 | 0.0 | 3.31e-05 | 31 | 39 | 22532 | 22532 | 12532 | 22532 | 3978 | 126 | 23197 | 1 | 1 | 22532 | 1 | 22532 | 154 | 1 | |
| The North Face Denali Down Mens Jacket 2013 | The North Face | Outerwear & Coats | 903.0 | 436.15 | 2709.0 | 1400.55 | 13 | 3 | 2 | 2 | 6 | 3612.0 | 1867.4 | 0.517 | 0.4 | 0.2727 | 0.1538 | 0.6667 | 0.0010035 | 0.001001 | 7.17e-05 | 5 | 10 | 7 | 7 | 423 | 2358 | 844 | 2100 | 1398 | 2 | 3 | 10735 | 8312 | 14284 | 12634 | 12990 |
| Canada Goose Women's Chilliwack Bomber | Canada Goose | Outerwear & Coats | 695.0 | 287.73 | 695.0 | 407.27 | 8 | 1 | 3 | 2 | 2 | 3475.0 | 2036.35 | 0.586 | 0.75 | 0.1667 | 0.25 | 0.6667 | 0.0002575 | 0.0002911 | 4.41e-05 | 46 | 52 | 294 | 240 | 5507 | 13264 | 151 | 2100 | 17069 | 3 | 2 | 3719 | 2834 | 19436 | 5542 | 12990 |
| Woolrich Arctic Parka DF | Woolrich | Outerwear & Coats | 990.0 | 478.17 | 2970.0 | 1535.49 | 12 | 3 | 2 | 1 | 6 | 2970.0 | 1535.49 | 0.517 | 0.4 | 0.2727 | 0.0833 | 0.6667 | 0.0011002 | 0.0010974 | 6.62e-05 | 3 | 6 | 5 | 6 | 694 | 2358 | 844 | 7029 | 1398 | 4 | 4 | 10735 | 8312 | 14284 | 17144 | 12990 |
| Mens Nike AirJordan Varsity Hoodie Jacket Grey / Black 451582-066 | Jordan | Outerwear & Coats | 903.0 | 409.06 | 903.0 | 493.94 | 8 | 1 | 2 | 1 | 4 | 2709.0 | 1481.82 | 0.547 | 0.6667 | 0.1429 | 0.125 | 0.8 | 0.0003345 | 0.000353 | 4.41e-05 | 5 | 14 | 149 | 153 | 5507 | 13264 | 844 | 7029 | 6105 | 5 | 6 | 7915 | 3055 | 20815 | 14338 | 7598 |
| NIKE WOMEN'S PRO COMPRESSION SPORTS BRA *Outstanding Support and Comfort* | Nike | Intimates | 903.0 | 512.0 | 0.0 | 0.0 | 4 | 0 | 0 | 3 | 1 | 2709.0 | 1173.0 | 0.0 | 0.75 | 1.0 | 0.0 | 0.0 | 2.21e-05 | 5 | 4 | 22532 | 22532 | 21053 | 22532 | 13463 | 526 | 23197 | 5 | 15 | 22532 | 25326 | 22532 | 109 | 1 | ||
| Spyder Women's Jesst In Time Jacket | Spyder | Outerwear & Coats | 650.0 | 295.75 | 3250.0 | 1771.25 | 10 | 5 | 4 | 0 | 1 | 2600.0 | 1417.0 | 0.545 | 0.4444 | 0.5 | 0.0 | 0.1667 | 0.0012039 | 0.0012659 | 5.52e-05 | 52 | 50 | 3 | 4 | 1962 | 251 | 30 | 17458 | 23197 | 7 | 7 | 8121 | 8264 | 3269 | 17458 | 27059 |
| IGIGI by Yuliya Raquel Plus Size Kandinsky Gown | IGIGI by Yuliya Raquel | Dresses | 325.0 | 136.17 | 0.0 | 0.0 | 13 | 0 | 3 | 5 | 5 | 2600.0 | 1510.6 | 1.0 | 0.0 | 0.3846 | 1.0 | 0.0 | 0.0 | 7.17e-05 | 236 | 300 | 22532 | 22532 | 423 | 22532 | 151 | 24 | 3026 | 7 | 5 | 22532 | 1 | 22532 | 2333 | 1 | |
| Canada Goose Women's Mystique | Canada Goose | Active | 750.0 | 280.5 | 750.0 | 469.5 | 9 | 1 | 1 | 2 | 5 | 2250.0 | 1408.5 | 0.626 | 0.5 | 0.1429 | 0.2222 | 0.8333 | 0.0002778 | 0.0003355 | 4.96e-05 | 37 | 53 | 230 | 170 | 3355 | 13264 | 3978 | 2100 | 3026 | 9 | 8 | 984 | 4275 | 20815 | 7837 | 6580 |
| Canada Goose Women's Mystique | Canada Goose | Outerwear & Coats | 750.0 | 353.25 | 1500.0 | 793.5 | 6 | 2 | 3 | 0 | 1 | 2250.0 | 1190.25 | 0.529 | 0.6 | 0.3333 | 0.0 | 0.3333 | 0.0005557 | 0.0005671 | 3.31e-05 | 37 | 35 | 41 | 44 | 12532 | 6114 | 151 | 17458 | 23197 | 9 | 13 | 9645 | 4103 | 9747 | 17458 | 24854 |
| Arc'teryx Moray Jacket - Women's | Arc'teryx | Outerwear & Coats | 699.0 | 343.91 | 2097.0 | 1065.28 | 9 | 3 | 0 | 3 | 3 | 2097.0 | 1065.28 | 0.508 | 0.0 | 0.5 | 0.3333 | 0.5 | 0.0007768 | 0.0007613 | 4.96e-05 | 41 | 36 | 15 | 20 | 3355 | 2358 | 13463 | 526 | 10869 | 11 | 22 | 11720 | 13463 | 3269 | 2619 | 19501 |
| Magaschoni Women's Shimmer Jacket | Magaschoni | Blazers & Jackets | 698.0 | 258.96 | 698.0 | 439.04 | 6 | 1 | 1 | 2 | 2 | 2094.0 | 1317.13 | 0.629 | 0.5 | 0.25 | 0.3333 | 0.6667 | 0.0002586 | 0.0003138 | 3.31e-05 | 43 | 58 | 288 | 201 | 12532 | 13264 | 3978 | 2100 | 17069 | 12 | 9 | 839 | 4275 | 14408 | 2619 | 12990 |
| Joseph Abboud Men's Super 120's Two Button Side Vent Single Pleat Pant Tuxedo With Grosgrain Notch Lapel | Joseph Abboud | Suits & Sport Coats | 405.26 | 145.08 | 405.26 | 260.18 | 11 | 1 | 2 | 3 | 5 | 2026.3 | 1300.88 | 0.642 | 0.6667 | 0.125 | 0.2727 | 0.8333 | 0.0001501 | 0.0001859 | 6.07e-05 | 108 | 256 | 961 | 686 | 1161 | 13264 | 844 | 526 | 3026 | 13 | 10 | 361 | 3055 | 21675 | 5408 | 6580 |
| Darla | Alpha Industries | Outerwear & Coats | 999.0 | 404.6 | 1998.0 | 1188.81 | 7 | 2 | 2 | 0 | 3 | 1998.0 | 1188.81 | 0.595 | 0.5 | 0.2857 | 0.0 | 0.6 | 0.0007401 | 0.0008496 | 3.86e-05 | 1 | 16 | 18 | 15 | 8625 | 6114 | 844 | 17458 | 10869 | 14 | 14 | 2925 | 4275 | 13238 | 17458 | 16953 |
| Alpha Industries Rip Stop Short | Alpha Industries | Shorts | 999.0 | 482.52 | 999.0 | 516.48 | 8 | 1 | 1 | 1 | 5 | 1998.0 | 1032.97 | 0.517 | 0.5 | 0.1429 | 0.125 | 0.8333 | 0.0003701 | 0.0003691 | 4.41e-05 | 1 | 5 | 120 | 134 | 5507 | 13264 | 3978 | 7029 | 3026 | 14 | 25 | 10735 | 4275 | 20815 | 14338 | 6580 |
Analytical Insights & Business Recommendations
The top 15 products by revenue are overwhelmingly dominated by Outerwear & Coats (11 of 15), with premium brands like The North Face, Canada Goose, Woolrich, Spyder, and Arc'teryx. This category commands the highest average sale prices ($595–$999) and generates the most revenue per unit sold. The top revenue product, ASICS Cushion Low Socks, is anomalous – priced at $903 (likely a data entry error or premium bundle) but sitting in the Active category. It ranks #1 in both revenue and profit with $3,612 and $2,116.63 respectively. Joseph Abboud Men's Sport Coat stands out as a high-volume high-revenue outlier with 30 unit orders placed (rank #7 across all products) while also ranking #5 in profit. This combination of volume and margin makes it the strongest candidate for promotional investment among top products.
The highest profit margin products (~66.9%) are exclusively Blazers & Jackets from mid-range brands (Fashion Love, Ulla Popken, Ted Baker, Eddie Bauer, DKNYC). These have low costs relative to sale prices but individually small revenue contributions. Since these high-margin blazer products have small individual revenue footprints, promote them in cohorts – bundle or cross-sell multiple blazer/jacket items together to amplify the margin advantage across a group rather than relying on individual unit sales. For top revenue products that already have strong demand (like the Joseph Abboud Sport Coat at 60.6% margin), consider strategic price testing. With 30 orders placed and strong brand recognition, there may be room to incrementally increase price by 3–5% without meaningfully reducing demand, yielding significant net profit gains given the volume.
Several top products have alarming return/cancellation profiles. The Canada Goose Men's Chateau Jacket has $0 in completed revenue – 100% of its orders were returned or cancelled, yet it ranks #1 in lost revenue ($4,075) and lost profit ($2,387.95). This product is generating no value while consuming inventory space, shipping bandwidth, and processing resources. IGIGI Kandinsky Gown similarly has a 100% return rate with $0 revenue and $2,600 in lost revenue. Both products warrant immediate quality inspection and supplier communication. The Spyder Women's Jesst In Time Jacket has a 44.4% return rate but still ranks #3 in revenue ($3,250) and #4 in profit ($1,771.25), meaning the returns are masking what could be even stronger performance. Investigate root causes of returns – sizing issues, product description mismatches, or quality defects. Products with high return rates among the top earners (Woolrich Arctic Parka at 40%, North Face Denali Down at 40%) should be flagged for quality inspection. Their return-related losses ($2,970 and $3,612 respectively) nearly equal their actual revenue, meaning nearly half of all potential profit is evaporating.
Bottom Products
Bottom products by Revenue
WITH first_layer AS (
SELECT
  p.name AS product_name,
  p.brand AS product_brand,
  p.category AS product_category,
  ROUND(AVG(oi.sale_price), 2) AS avg_product_sale_price,
  ROUND(AVG(p.cost), 2) AS avg_product_cost,
ROUND(SUM(CASE WHEN oi.status = 'Complete' THEN oi.sale_price ELSE 0 END), 2) AS
revenue,
ROUND(SUM(CASE WHEN oi.status = 'Complete' THEN (oi.sale_price - p.cost) ELSE 0
END), 2) AS profit,
COUNT(*) AS unit_orders_placed,
SUM(CASE WHEN oi.status = 'Complete' THEN 1 ELSE 0 END) AS units_completed,
SUM(CASE WHEN oi.status = 'Returned' THEN 1 ELSE 0 END) AS units_returned,
SUM(CASE WHEN oi.status = 'Cancelled' THEN 1 ELSE 0 END) AS units_cancelled,
SUM(CASE WHEN oi.status IN ('Shipped', 'Processing') THEN 1 ELSE 0 END) AS units_en_route,
ROUND(SUM(CASE WHEN oi.status IN ('Returned', 'Cancelled') THEN oi.sale_price ELSE 0 END), 2) AS lost_revenue,
ROUND(SUM(CASE WHEN oi.status IN ('Returned', 'Cancelled') THEN (oi.sale_price - p.cost) ELSE 0 END), 2) AS lost_profit
FROM `bigquery-public-data.thelook_ecommerce.order_items` AS oi
JOIN `bigquery-public-data.thelook_ecommerce.orders` AS o
ON oi.order_id = o.order_id
JOIN `bigquery-public-data.thelook_ecommerce.products` AS p
ON oi.product_id = p.id
GROUP BY product_name, product_brand, product_category
),
second_layer AS (
SELECT
  *,
  ROUND((profit / NULLIF(revenue, 0)), 4) AS profit_margin,
  ROUND(units_returned / NULLIF(units_completed + units_returned, 0), 4) AS return_rate,
  ROUND(units_completed / NULLIF(unit_orders_placed - units_cancelled, 0), 4) AS completion_rate,
  ROUND(units_cancelled / NULLIF(unit_orders_placed, 0), 4) AS cancellation_rate,
  ROUND(units_en_route / NULLIF(unit_orders_placed - (units_cancelled + units_returned), 0), 4) AS en_route_rate,
  ROUND(revenue / SUM(revenue) OVER(), 7) AS revenue_share,
  ROUND(profit / SUM(profit) OVER(), 7) AS profit_share,
  ROUND(unit_orders_placed / SUM(unit_orders_placed) OVER(), 7) AS unit_orders_placed_share
FROM first_layer
)
SELECT
  *,
  RANK() OVER(ORDER BY avg_product_sale_price DESC) AS avg_product_sale_price_rank,
  RANK() OVER(ORDER BY avg_product_cost DESC) AS avg_product_cost_rank,
  RANK() OVER(ORDER BY revenue DESC) AS revenue_rank,
  RANK() OVER(ORDER BY profit DESC) AS profit_rank,
  RANK() OVER(ORDER BY unit_orders_placed DESC) AS unit_orders_placed_rank,
  RANK() OVER(ORDER BY units_completed DESC) AS units_completed_rank,
  RANK() OVER(ORDER BY units_returned DESC) AS units_returned_rank,
  RANK() OVER(ORDER BY units_cancelled DESC) AS units_cancelled_rank,
  RANK() OVER(ORDER BY units_en_route DESC) AS units_en_route_rank,
  RANK() OVER(ORDER BY lost_revenue DESC) AS lost_revenue_rank,
  RANK() OVER(ORDER BY lost_profit DESC) AS lost_profit_rank,
  RANK() OVER(ORDER BY profit_margin DESC) AS profit_margin_rank,
  RANK() OVER(ORDER BY return_rate DESC) AS return_rate_rank,
  RANK() OVER(ORDER BY completion_rate DESC) AS completion_rate_rank,
  RANK() OVER(ORDER BY cancellation_rate DESC) AS cancellation_rate_rank,
  RANK() OVER(ORDER BY en_route_rate DESC) AS en_route_rate_rank
FROM second_layer
ORDER BY
  revenue_rank DESC
LIMIT 15;| product_name | product_brand | product_category | avg_product_sale_price | avg_product_cost | revenue | profit | unit_orders_placed | units_completed | units_returned | units_cancelled | units_en_route | lost_revenue | lost_profit | profit_margin | return_rate | completion_rate | cancellation_rate | en_route_rate | revenue_share | profit_share | unit_orders_placed_share | avg_product_sale_price_rank | avg_product_cost_rank | revenue_rank | profit_rank | unit_orders_placed_rank | units_completed_rank | units_returned_rank | units_cancelled_rank | units_en_route_rank | lost_revenue_rank | lost_profit_rank | profit_margin_rank | return_rate_rank | completion_rate_rank | cancellation_rate_rank | en_route_rate_rank |
|---|---|---|---|---|---|---|---|---|---|---|---|---|---|---|---|---|---|---|---|---|---|---|---|---|---|---|---|---|---|---|---|---|---|---|---|---|---|
| Marc Ecko Cut & Sew Men's Pinstripe and Plaid Pieced Vest | Marc Ecko Cut & Sew | Suits & Sport Coats | 47.43 | 17.83 | 0.0 | 0.0 | 10 | 0 | 0 | 3 | 7 | 142.29 | 88.79 | 0.0 | 0.3 | 1.0 | 0.0 | 0.0 | 5.52e-05 | 12005 | 15475 | 22532 | 22532 | 1962 | 22532 | 13463 | 526 | 623 | 5528 | 4189 | 22532 | 25326 | 22532 | 4443 | 1 | ||
| Dexter's Wings - Dexter T-shirt | Dexter | Tops & Tees | 19.95 | 11.11 | 0.0 | 0.0 | 5 | 0 | 1 | 1 | 3 | 39.9 | 17.68 | 1.0 | 0.0 | 0.2 | 1.0 | 0.0 | 0.0 | 2.76e-05 | 23040 | 21439 | 22532 | 22532 | 16887 | 22532 | 3978 | 7029 | 10869 | 16370 | 17124 | 22532 | 1 | 22532 | 8435 | 1 | |
| RSQ Miami Womens Jeggings | RSQ | Pants & Capris | 39.99 | 22.07 | 0.0 | 0.0 | 4 | 0 | 1 | 1 | 2 | 79.98 | 35.83 | 1.0 | 0.0 | 0.25 | 1.0 | 0.0 | 0.0 | 2.21e-05 | 13925 | 12599 | 22532 | 22532 | 21053 | 22532 | 3978 | 7029 | 17069 | 10039 | 11208 | 22532 | 1 | 22532 | 5542 | 1 | |
| Medela Sleep Bra Nude Large | Medela | Maternity | 15.99 | 6.88 | 0.0 | 0.0 | 7 | 0 | 3 | 1 | 3 | 63.96 | 36.46 | 1.0 | 0.0 | 0.1429 | 1.0 | 0.0 | 0.0 | 3.86e-05 | 24393 | 25240 | 22532 | 22532 | 8625 | 22532 | 151 | 7029 | 10869 | 12226 | 11055 | 22532 | 1 | 22532 | 12706 | 1 | |
| Diesel Women's Louvboot Slim Flare Jean | Diesel | Jeans | 198.0 | 97.61 | 0.0 | 0.0 | 4 | 0 | 0 | 2 | 2 | 396.0 | 200.77 | 0.0 | 0.5 | 1.0 | 0.0 | 0.0 | 2.21e-05 | 875 | 836 | 22532 | 22532 | 21053 | 22532 | 13463 | 2100 | 17069 | 1005 | 1124 | 22532 | 25326 | 22532 | 477 | 1 | ||
| SockGuy Men's Wooligan Socks | SockGuy | Socks | 12.95 | 7.33 | 0.0 | 0.0 | 4 | 0 | 0 | 2 | 2 | 25.9 | 11.24 | 0.0 | 0.5 | 1.0 | 0.0 | 0.0 | 2.21e-05 | 25924 | 24844 | 22532 | 22532 | 21053 | 22532 | 13463 | 2100 | 17069 | 19080 | 19933 | 22532 | 25326 | 22532 | 477 | 1 | ||
| Allegra K Mens Casual Vertical Stripes Pattern Decor NEW Stylish Short Trousers Deep Beige W31 | Allegra K | Shorts | 15.95 | 7.99 | 0.0 | 0.0 | 6 | 0 | 1 | 0 | 5 | 15.95 | 7.96 | 1.0 | 0.0 | 0.0 | 1.0 | 0.0 | 0.0 | 3.31e-05 | 24488 | 24197 | 22532 | 22532 | 12532 | 22532 | 3978 | 17458 | 3026 | 21250 | 21221 | 22532 | 1 | 22532 | 17458 | 1 | |
| Southpole Men's Angled Cross With Shadowed Background Print Fashion T-Shirt | Southpole | Tops & Tees | 25.0 | 13.52 | 0.0 | 0.0 | 6 | 0 | 0 | 1 | 5 | 25.0 | 11.48 | 0.0 | 0.1667 | 1.0 | 0.0 | 0.0 | 3.31e-05 | 19651 | 19040 | 22532 | 22532 | 12532 | 22532 | 13463 | 7029 | 3026 | 19164 | 19837 | 22532 | 25326 | 22532 | 10731 | 1 | ||
| Brushed-Back Satin Pajamas - Women's Sizes | Carol Wright Gifts | Sleep & Lounge | 24.99 | 15.07 | 0.0 | 0.0 | 3 | 0 | 1 | 0 | 2 | 24.99 | 9.92 | 1.0 | 0.0 | 0.0 | 1.0 | 0.0 | 0.0 | 1.65e-05 | 20698 | 17708 | 22532 | 22532 | 24645 | 22532 | 3978 | 17458 | 17069 | 19500 | 20477 | 22532 | 1 | 22532 | 17458 | 1 | |
| Tommy Hilfiger Men's Tommy Tartan Boxer | Tommy Hilfiger | Underwear | 18.0 | 8.69 | 0.0 | 0.0 | 5 | 0 | 1 | 1 | 3 | 36.0 | 18.61 | 1.0 | 0.0 | 0.2 | 1.0 | 0.0 | 0.0 | 2.76e-05 | 23512 | 23579 | 22532 | 22532 | 16887 | 22532 | 3978 | 7029 | 10869 | 16903 | 16747 | 22532 | 1 | 22532 | 8435 | 1 | |
| One Pair MarcolianiMen's Italian Cashmere and Silk Over-the-Calf Fancy Argyle Socks | Marcoliani Milano | Socks | 89.5 | 49.58 | 0.0 | 0.0 | 2 | 0 | 1 | 0 | 1 | 89.5 | 39.92 | 1.0 | 0.0 | 0.0 | 1.0 | 0.0 | 0.0 | 1.1e-05 | 4936 | 3880 | 22532 | 22532 | 26863 | 22532 | 3978 | 17458 | 23197 | 9283 | 10290 | 22532 | 1 | 22532 | 17458 | 1 | |
| Allegra K Ladies Dotted Double V Neck Banded Dress Pink White M | Allegra K | Dresses | 10.15 | 4.83 | 0.0 | 0.0 | 5 | 0 | 0 | 0 | 5 | 0.0 | 0.0 | 0.0 | 0.0 | 1.0 | 0.0 | 0.0 | 2.76e-05 | 26937 | 27097 | 22532 | 22532 | 16887 | 22532 | 13463 | 17458 | 3026 | 22642 | 22642 | 22532 | 25326 | 22532 | 17458 | 1 | ||
| 7 For All Mankind Women's Relaxed Mid Roll Up Short Authentic Nakita | 7 For All Mankind | Shorts | 178.0 | 82.95 | 0.0 | 0.0 | 6 | 0 | 2 | 1 | 3 | 534.0 | 285.16 | 1.0 | 0.0 | 0.1667 | 1.0 | 0.0 | 0.0 | 3.31e-05 | 1246 | 1403 | 22532 | 22532 | 12532 | 22532 | 844 | 7029 | 10869 | 570 | 582 | 22532 | 1 | 22532 | 10731 | 1 | |
| Fox Men's Essex Short | Fox | Shorts | 42.5 | 19.51 | 0.0 | 0.0 | 3 | 0 | 0 | 1 | 2 | 42.5 | 22.99 | 0.0 | 0.3333 | 1.0 | 0.0 | 0.0 | 1.65e-05 | 13301 | 14268 | 22532 | 22532 | 24645 | 22532 | 13463 | 7029 | 17069 | 15731 | 15034 | 22532 | 25326 | 22532 | 2619 | 1 | ||
| Motherhood Maternity: Plus Size Secret Fit Belly(r) Boot Cut Maternity Jeans | Motherhood Maternity | Maternity | 34.98 | 15.74 | 0.0 | 0.0 | 3 | 0 | 0 | 0 | 3 | 0.0 | 0.0 | 0.0 | 0.0 | 1.0 | 0.0 | 0.0 | 1.65e-05 | 16197 | 17160 | 22532 | 22532 | 24645 | 22532 | 13463 | 17458 | 10869 | 22642 | 22642 | 22532 | 25326 | 22532 | 17458 | 1 |
Analytical Insights & Business Recommendations
The bottom 15 products by revenue all show $0 in completed revenue – every order for these items was either cancelled, returned, or is still in transit with no completions. Products like Marc Ecko Cut & Sew Pinstripe Vest (10 orders, $0 revenue), Diesel Women's Louvboot Slim Flare Jean (4 orders, $0 revenue), and Allegra K Dotted Dress (5 orders, $0 revenue) are occupying warehouse space and shipping bandwidth without generating any return. Many of these zero-revenue products still have units en route (shown by en_route_rate of 1.0), meaning they are actively consuming fulfillment resources. Others have high cancellation rates, suggesting customers are abandoning these purchases during checkout or processing.
Recommendation: These zero-revenue products should be evaluated for delisting. If a product has generated multiple orders but zero completions, the pattern indicates either a systemic quality issue, misleading product listings, or severe delivery problems. Flag all products with 3+ orders and $0 revenue for an immediate review, and consider removing them from active listings if the pattern persists, as they are wasting inventory space and shipping bandwidth that could serve profitable items.
Top Brands
Top brands by Revenue
WITH first_layer AS (
SELECT
  p.brand AS product_brand,
  ROUND(AVG(oi.sale_price), 2) AS avg_product_sale_price,
  ROUND(AVG(p.cost), 2) AS avg_product_cost,
ROUND(SUM(CASE WHEN oi.status = 'Complete' THEN oi.sale_price ELSE 0 END), 2) AS
revenue,
ROUND(SUM(CASE WHEN oi.status = 'Complete' THEN (oi.sale_price - p.cost) ELSE 0
END), 2) AS profit,
COUNT(*) AS unit_orders_placed,
SUM(CASE WHEN oi.status = 'Complete' THEN 1 ELSE 0 END) AS units_completed,
SUM(CASE WHEN oi.status = 'Returned' THEN 1 ELSE 0 END) AS units_returned,
SUM(CASE WHEN oi.status = 'Cancelled' THEN 1 ELSE 0 END) AS units_cancelled,
SUM(CASE WHEN oi.status IN ('Shipped', 'Processing') THEN 1 ELSE 0 END) AS units_en_route,
ROUND(SUM(CASE WHEN oi.status IN ('Returned', 'Cancelled') THEN oi.sale_price ELSE 0 END), 2) AS lost_revenue,
ROUND(SUM(CASE WHEN oi.status IN ('Returned', 'Cancelled') THEN (oi.sale_price - p.cost) ELSE 0 END), 2) AS lost_profit
FROM `bigquery-public-data.thelook_ecommerce.order_items` AS oi
JOIN `bigquery-public-data.thelook_ecommerce.orders` AS o
ON oi.order_id = o.order_id
JOIN `bigquery-public-data.thelook_ecommerce.products` AS p
ON oi.product_id = p.id
GROUP BY product_brand
),
second_layer AS (
SELECT
  *,
  ROUND((profit / NULLIF(revenue, 0)), 4) AS profit_margin,
  ROUND(units_returned / NULLIF(units_completed + units_returned, 0), 4) AS return_rate,
  ROUND(units_completed / NULLIF(unit_orders_placed - units_cancelled, 0), 4) AS completion_rate,
  ROUND(units_cancelled / NULLIF(unit_orders_placed, 0), 4) AS cancellation_rate,
  ROUND(units_en_route / NULLIF(unit_orders_placed - (units_cancelled + units_returned), 0), 4) AS en_route_rate,
  ROUND(revenue / SUM(revenue) OVER(), 7) AS revenue_share,
  ROUND(profit / SUM(profit) OVER(), 7) AS profit_share,
  ROUND(unit_orders_placed / SUM(unit_orders_placed) OVER(), 7) AS unit_orders_placed_share
FROM first_layer
)
SELECT
  *,
  RANK() OVER(ORDER BY avg_product_sale_price DESC) AS avg_product_sale_price_rank,
  RANK() OVER(ORDER BY avg_product_cost DESC) AS avg_product_cost_rank,
  RANK() OVER(ORDER BY revenue DESC) AS revenue_rank,
  RANK() OVER(ORDER BY profit DESC) AS profit_rank,
  RANK() OVER(ORDER BY unit_orders_placed DESC) AS unit_orders_placed_rank,
  RANK() OVER(ORDER BY units_completed DESC) AS units_completed_rank,
  RANK() OVER(ORDER BY units_returned DESC) AS units_returned_rank,
  RANK() OVER(ORDER BY units_cancelled DESC) AS units_cancelled_rank,
  RANK() OVER(ORDER BY units_en_route DESC) AS units_en_route_rank,
  RANK() OVER(ORDER BY lost_revenue DESC) AS lost_revenue_rank,
  RANK() OVER(ORDER BY lost_profit DESC) AS lost_profit_rank,
  RANK() OVER(ORDER BY profit_margin DESC) AS profit_margin_rank,
  RANK() OVER(ORDER BY return_rate DESC) AS return_rate_rank,
  RANK() OVER(ORDER BY completion_rate DESC) AS completion_rate_rank,
  RANK() OVER(ORDER BY cancellation_rate DESC) AS cancellation_rate_rank,
  RANK() OVER(ORDER BY en_route_rate DESC) AS en_route_rate_rank
FROM second_layer
ORDER BY
  revenue_rank ASC
LIMIT 15;| product_brand | avg_product_sale_price | avg_product_cost | revenue | profit | unit_orders_placed | units_completed | units_returned | units_cancelled | units_en_route | lost_revenue | lost_profit | profit_margin | return_rate | completion_rate | cancellation_rate | en_route_rate | revenue_share | profit_share | unit_orders_placed_share | avg_product_sale_price_rank | avg_product_cost_rank | revenue_rank | profit_rank | unit_orders_placed_rank | units_completed_rank | units_returned_rank | units_cancelled_rank | units_en_route_rank | lost_revenue_rank | lost_profit_rank | profit_margin_rank | return_rate_rank | completion_rate_rank | cancellation_rate_rank | en_route_rate_rank |
|---|---|---|---|---|---|---|---|---|---|---|---|---|---|---|---|---|---|---|---|---|---|---|---|---|---|---|---|---|---|---|---|---|---|---|---|
| Diesel | 138.24 | 68.92 | 53774.81 | 27000.8 | 1466 | 378 | 143 | 213 | 732 | 49754.6 | 24735.41 | 0.5021 | 0.2745 | 0.3017 | 0.1453 | 0.6595 | 0.0199204 | 0.0192971 | 0.0080872 | 205 | 184 | 1 | 2 | 13 | 10 | 12 | 13 | 13 | 1 | 2 | 1502 | 1319 | 1221 | 1318 | 1552 |
| Calvin Klein | 62.49 | 29.31 | 53041.76 | 28267.04 | 3180 | 820 | 322 | 471 | 1567 | 48698.1 | 25795.42 | 0.5329 | 0.282 | 0.3027 | 0.1481 | 0.6565 | 0.0196488 | 0.0202021 | 0.0175425 | 805 | 836 | 2 | 1 | 2 | 2 | 2 | 2 | 2 | 2 | 1 | 1128 | 1282 | 1212 | 1270 | 1568 |
| Carhartt | 68.41 | 32.02 | 44947.96 | 23945.23 | 2509 | 663 | 251 | 366 | 1229 | 41134.22 | 22022.28 | 0.5327 | 0.2746 | 0.3094 | 0.1459 | 0.6496 | 0.0166506 | 0.0171134 | 0.0138409 | 703 | 724 | 3 | 3 | 3 | 3 | 3 | 3 | 3 | 5 | 3 | 1132 | 1317 | 1155 | 1311 | 1623 |
| True Religion | 196.17 | 101.7 | 43598.78 | 21127.8 | 879 | 225 | 84 | 146 | 424 | 43136.54 | 20619.76 | 0.4846 | 0.2718 | 0.307 | 0.1661 | 0.6533 | 0.0161508 | 0.0150998 | 0.004849 | 91 | 64 | 4 | 4 | 27 | 28 | 33 | 25 | 29 | 4 | 5 | 1705 | 1347 | 1186 | 1064 | 1592 |
| 7 For All Mankind | 155.67 | 81.33 | 39429.55 | 18708.21 | 1086 | 254 | 108 | 179 | 545 | 44113.73 | 21179.32 | 0.4745 | 0.2983 | 0.28 | 0.1648 | 0.6821 | 0.0146063 | 0.0133705 | 0.0059909 | 156 | 123 | 5 | 5 | 20 | 24 | 19 | 19 | 20 | 3 | 4 | 1826 | 1168 | 1503 | 1067 | 1192 |
| Volcom | 58.67 | 29.91 | 28804.39 | 14059.0 | 1893 | 482 | 182 | 294 | 935 | 26458.99 | 12887.05 | 0.4881 | 0.2741 | 0.3014 | 0.1553 | 0.6598 | 0.0106703 | 0.0100478 | 0.0104428 | 877 | 805 | 6 | 8 | 5 | 4 | 7 | 5 | 5 | 9 | 10 | 1663 | 1320 | 1223 | 1174 | 1547 |
| Quiksilver | 57.01 | 30.91 | 27609.19 | 12579.68 | 1873 | 471 | 202 | 297 | 903 | 26410.17 | 12067.7 | 0.4556 | 0.3001 | 0.2989 | 0.1586 | 0.6572 | 0.0102276 | 0.0089905 | 0.0103324 | 903 | 764 | 7 | 14 | 6 | 6 | 5 | 4 | 7 | 10 | 14 | 2066 | 1129 | 1275 | 1126 | 1563 |
| Columbia | 69.37 | 31.72 | 26587.28 | 14439.48 | 1529 | 374 | 135 | 252 | 768 | 26842.48 | 14585.03 | 0.5431 | 0.2652 | 0.2929 | 0.1648 | 0.6725 | 0.009849 | 0.0103197 | 0.0084347 | 687 | 737 | 8 | 6 | 11 | 11 | 13 | 9 | 11 | 8 | 7 | 987 | 1379 | 1340 | 1067 | 1270 |
| Tommy Hilfiger | 71.62 | 32.46 | 26074.49 | 14100.38 | 1615 | 404 | 162 | 254 | 795 | 29731.26 | 16179.42 | 0.5408 | 0.2862 | 0.2968 | 0.1573 | 0.6631 | 0.0096591 | 0.0100774 | 0.0089092 | 649 | 706 | 9 | 7 | 8 | 8 | 10 | 8 | 9 | 6 | 6 | 1021 | 1218 | 1294 | 1152 | 1525 |
| Orvis | 128.92 | 60.07 | 25260.0 | 13494.35 | 721 | 186 | 65 | 102 | 368 | 21012.0 | 11275.59 | 0.5342 | 0.259 | 0.3005 | 0.1415 | 0.6643 | 0.0093573 | 0.0096442 | 0.0039774 | 239 | 245 | 10 | 12 | 39 | 39 | 47 | 44 | 38 | 17 | 17 | 1110 | 1416 | 1228 | 1453 | 1519 |
| The North Face | 440.81 | 197.82 | 25174.88 | 13719.13 | 233 | 61 | 20 | 36 | 116 | 21048.75 | 11669.08 | 0.545 | 0.2469 | 0.3096 | 0.1545 | 0.6554 | 0.0093258 | 0.0098049 | 0.0012853 | 9 | 9 | 11 | 10 | 153 | 152 | 182 | 151 | 153 | 16 | 16 | 962 | 1608 | 1153 | 1181 | 1574 |
| Joe's Jeans | 152.81 | 80.23 | 25134.81 | 11891.96 | 697 | 169 | 76 | 99 | 353 | 27326.02 | 13164.83 | 0.4731 | 0.3102 | 0.2826 | 0.142 | 0.6762 | 0.009311 | 0.008499 | 0.003845 | 163 | 133 | 12 | 15 | 41 | 42 | 38 | 47 | 41 | 7 | 9 | 1850 | 1094 | 1486 | 1448 | 1239 |
| Jones New York | 100.52 | 45.47 | 24723.78 | 13604.24 | 846 | 230 | 96 | 114 | 406 | 20262.41 | 10960.83 | 0.5502 | 0.2945 | 0.3142 | 0.1348 | 0.6384 | 0.0091587 | 0.0097228 | 0.004667 | 361 | 403 | 13 | 11 | 32 | 27 | 27 | 34 | 33 | 18 | 18 | 876 | 1178 | 1106 | 1532 | 1701 |
| Oakley | 110.41 | 49.26 | 24423.2 | 13410.52 | 866 | 225 | 90 | 118 | 433 | 23073.48 | 12801.68 | 0.5491 | 0.2857 | 0.3008 | 0.1363 | 0.6581 | 0.0090474 | 0.0095843 | 0.0047773 | 316 | 355 | 14 | 13 | 29 | 28 | 30 | 33 | 27 | 12 | 12 | 896 | 1219 | 1227 | 1522 | 1556 |
| Ray-Ban | 118.89 | 50.08 | 23852.78 | 13833.41 | 798 | 206 | 78 | 131 | 383 | 25134.08 | 14434.77 | 0.5799 | 0.2746 | 0.3088 | 0.1642 | 0.6503 | 0.008836 | 0.0098866 | 0.0044022 | 278 | 346 | 15 | 9 | 34 | 32 | 35 | 30 | 37 | 11 | 8 | 437 | 1317 | 1160 | 1073 | 1612 |
Top brands by Lost Revenue
WITH first_layer AS (
SELECT
  p.brand AS product_brand,
  ROUND(AVG(oi.sale_price), 2) AS avg_product_sale_price,
  ROUND(AVG(p.cost), 2) AS avg_product_cost,
ROUND(SUM(CASE WHEN oi.status = 'Complete' THEN oi.sale_price ELSE 0 END), 2) AS
revenue,
ROUND(SUM(CASE WHEN oi.status = 'Complete' THEN (oi.sale_price - p.cost) ELSE 0
END), 2) AS profit,
COUNT(*) AS unit_orders_placed,
SUM(CASE WHEN oi.status = 'Complete' THEN 1 ELSE 0 END) AS units_completed,
SUM(CASE WHEN oi.status = 'Returned' THEN 1 ELSE 0 END) AS units_returned,
SUM(CASE WHEN oi.status = 'Cancelled' THEN 1 ELSE 0 END) AS units_cancelled,
SUM(CASE WHEN oi.status IN ('Shipped', 'Processing') THEN 1 ELSE 0 END) AS units_en_route,
ROUND(SUM(CASE WHEN oi.status IN ('Returned', 'Cancelled') THEN oi.sale_price ELSE 0 END), 2) AS lost_revenue,
ROUND(SUM(CASE WHEN oi.status IN ('Returned', 'Cancelled') THEN (oi.sale_price - p.cost) ELSE 0 END), 2) AS lost_profit
FROM `bigquery-public-data.thelook_ecommerce.order_items` AS oi
JOIN `bigquery-public-data.thelook_ecommerce.orders` AS o
ON oi.order_id = o.order_id
JOIN `bigquery-public-data.thelook_ecommerce.products` AS p
ON oi.product_id = p.id
GROUP BY product_brand
),
second_layer AS (
SELECT
  *,
  ROUND((profit / NULLIF(revenue, 0)), 4) AS profit_margin,
  ROUND(units_returned / NULLIF(units_completed + units_returned, 0), 4) AS return_rate,
  ROUND(units_completed / NULLIF(unit_orders_placed - units_cancelled, 0), 4) AS completion_rate,
  ROUND(units_cancelled / NULLIF(unit_orders_placed, 0), 4) AS cancellation_rate,
  ROUND(units_en_route / NULLIF(unit_orders_placed - (units_cancelled + units_returned), 0), 4) AS en_route_rate,
  ROUND(revenue / SUM(revenue) OVER(), 7) AS revenue_share,
  ROUND(profit / SUM(profit) OVER(), 7) AS profit_share,
  ROUND(unit_orders_placed / SUM(unit_orders_placed) OVER(), 7) AS unit_orders_placed_share
FROM first_layer
)
SELECT
  *,
  RANK() OVER(ORDER BY avg_product_sale_price DESC) AS avg_product_sale_price_rank,
  RANK() OVER(ORDER BY avg_product_cost DESC) AS avg_product_cost_rank,
  RANK() OVER(ORDER BY revenue DESC) AS revenue_rank,
  RANK() OVER(ORDER BY profit DESC) AS profit_rank,
  RANK() OVER(ORDER BY unit_orders_placed DESC) AS unit_orders_placed_rank,
  RANK() OVER(ORDER BY units_completed DESC) AS units_completed_rank,
  RANK() OVER(ORDER BY units_returned DESC) AS units_returned_rank,
  RANK() OVER(ORDER BY units_cancelled DESC) AS units_cancelled_rank,
  RANK() OVER(ORDER BY units_en_route DESC) AS units_en_route_rank,
  RANK() OVER(ORDER BY lost_revenue DESC) AS lost_revenue_rank,
  RANK() OVER(ORDER BY lost_profit DESC) AS lost_profit_rank,
  RANK() OVER(ORDER BY profit_margin DESC) AS profit_margin_rank,
  RANK() OVER(ORDER BY return_rate DESC) AS return_rate_rank,
  RANK() OVER(ORDER BY completion_rate DESC) AS completion_rate_rank,
  RANK() OVER(ORDER BY cancellation_rate DESC) AS cancellation_rate_rank,
  RANK() OVER(ORDER BY en_route_rate DESC) AS en_route_rate_rank
FROM second_layer
ORDER BY
  lost_revenue_rank ASC
LIMIT 15;| product_brand | avg_product_sale_price | avg_product_cost | revenue | profit | unit_orders_placed | units_completed | units_returned | units_cancelled | units_en_route | lost_revenue | lost_profit | profit_margin | return_rate | completion_rate | cancellation_rate | en_route_rate | revenue_share | profit_share | unit_orders_placed_share | avg_product_sale_price_rank | avg_product_cost_rank | revenue_rank | profit_rank | unit_orders_placed_rank | units_completed_rank | units_returned_rank | units_cancelled_rank | units_en_route_rank | lost_revenue_rank | lost_profit_rank | profit_margin_rank | return_rate_rank | completion_rate_rank | cancellation_rate_rank | en_route_rate_rank |
|---|---|---|---|---|---|---|---|---|---|---|---|---|---|---|---|---|---|---|---|---|---|---|---|---|---|---|---|---|---|---|---|---|---|---|---|
| Diesel | 138.24 | 68.92 | 53774.81 | 27000.8 | 1466 | 378 | 143 | 213 | 732 | 49754.6 | 24735.41 | 0.5021 | 0.2745 | 0.3017 | 0.1453 | 0.6595 | 0.0199204 | 0.0192971 | 0.0080872 | 205 | 184 | 1 | 2 | 13 | 10 | 12 | 13 | 13 | 1 | 2 | 1502 | 1319 | 1221 | 1318 | 1552 |
| Calvin Klein | 62.49 | 29.31 | 53041.76 | 28267.04 | 3180 | 820 | 322 | 471 | 1567 | 48698.1 | 25795.42 | 0.5329 | 0.282 | 0.3027 | 0.1481 | 0.6565 | 0.0196488 | 0.0202021 | 0.0175425 | 805 | 836 | 2 | 1 | 2 | 2 | 2 | 2 | 2 | 2 | 1 | 1128 | 1282 | 1212 | 1270 | 1568 |
| 7 For All Mankind | 155.67 | 81.33 | 39429.55 | 18708.21 | 1086 | 254 | 108 | 179 | 545 | 44113.73 | 21179.32 | 0.4745 | 0.2983 | 0.28 | 0.1648 | 0.6821 | 0.0146063 | 0.0133705 | 0.0059909 | 156 | 123 | 5 | 5 | 20 | 24 | 19 | 19 | 20 | 3 | 4 | 1826 | 1168 | 1503 | 1067 | 1192 |
| True Religion | 196.17 | 101.7 | 43598.78 | 21127.8 | 879 | 225 | 84 | 146 | 424 | 43136.54 | 20619.76 | 0.4846 | 0.2718 | 0.307 | 0.1661 | 0.6533 | 0.0161508 | 0.0150998 | 0.004849 | 91 | 64 | 4 | 4 | 27 | 28 | 33 | 25 | 29 | 4 | 5 | 1705 | 1347 | 1186 | 1064 | 1592 |
| Carhartt | 68.41 | 32.02 | 44947.96 | 23945.23 | 2509 | 663 | 251 | 366 | 1229 | 41134.22 | 22022.28 | 0.5327 | 0.2746 | 0.3094 | 0.1459 | 0.6496 | 0.0166506 | 0.0171134 | 0.0138409 | 703 | 724 | 3 | 3 | 3 | 3 | 3 | 3 | 3 | 5 | 3 | 1132 | 1317 | 1155 | 1311 | 1623 |
| Tommy Hilfiger | 71.62 | 32.46 | 26074.49 | 14100.38 | 1615 | 404 | 162 | 254 | 795 | 29731.26 | 16179.42 | 0.5408 | 0.2862 | 0.2968 | 0.1573 | 0.6631 | 0.0096591 | 0.0100774 | 0.0089092 | 649 | 706 | 9 | 7 | 8 | 8 | 10 | 8 | 9 | 6 | 6 | 1021 | 1218 | 1294 | 1152 | 1525 |
| Joe's Jeans | 152.81 | 80.23 | 25134.81 | 11891.96 | 697 | 169 | 76 | 99 | 353 | 27326.02 | 13164.83 | 0.4731 | 0.3102 | 0.2826 | 0.142 | 0.6762 | 0.009311 | 0.008499 | 0.003845 | 163 | 133 | 12 | 15 | 41 | 42 | 38 | 47 | 41 | 7 | 9 | 1850 | 1094 | 1486 | 1448 | 1239 |
| Columbia | 69.37 | 31.72 | 26587.28 | 14439.48 | 1529 | 374 | 135 | 252 | 768 | 26842.48 | 14585.03 | 0.5431 | 0.2652 | 0.2929 | 0.1648 | 0.6725 | 0.009849 | 0.0103197 | 0.0084347 | 687 | 737 | 8 | 6 | 11 | 11 | 13 | 9 | 11 | 8 | 7 | 987 | 1379 | 1340 | 1067 | 1270 |
| Volcom | 58.67 | 29.91 | 28804.39 | 14059.0 | 1893 | 482 | 182 | 294 | 935 | 26458.99 | 12887.05 | 0.4881 | 0.2741 | 0.3014 | 0.1553 | 0.6598 | 0.0106703 | 0.0100478 | 0.0104428 | 877 | 805 | 6 | 8 | 5 | 4 | 7 | 5 | 5 | 9 | 10 | 1663 | 1320 | 1223 | 1174 | 1547 |
| Quiksilver | 57.01 | 30.91 | 27609.19 | 12579.68 | 1873 | 471 | 202 | 297 | 903 | 26410.17 | 12067.7 | 0.4556 | 0.3001 | 0.2989 | 0.1586 | 0.6572 | 0.0102276 | 0.0089905 | 0.0103324 | 903 | 764 | 7 | 14 | 6 | 6 | 5 | 4 | 7 | 10 | 14 | 2066 | 1129 | 1275 | 1126 | 1563 |
| Ray-Ban | 118.89 | 50.08 | 23852.78 | 13833.41 | 798 | 206 | 78 | 131 | 383 | 25134.08 | 14434.77 | 0.5799 | 0.2746 | 0.3088 | 0.1642 | 0.6503 | 0.008836 | 0.0098866 | 0.0044022 | 278 | 346 | 15 | 9 | 34 | 32 | 35 | 30 | 37 | 11 | 8 | 437 | 1317 | 1160 | 1073 | 1612 |
| Oakley | 110.41 | 49.26 | 24423.2 | 13410.52 | 866 | 225 | 90 | 118 | 433 | 23073.48 | 12801.68 | 0.5491 | 0.2857 | 0.3008 | 0.1363 | 0.6581 | 0.0090474 | 0.0095843 | 0.0047773 | 316 | 355 | 14 | 13 | 29 | 28 | 30 | 33 | 27 | 12 | 12 | 896 | 1219 | 1227 | 1522 | 1556 |
| Arc'teryx | 323.7 | 146.18 | 18141.7 | 9908.14 | 271 | 56 | 22 | 41 | 152 | 22880.85 | 12500.89 | 0.5462 | 0.2821 | 0.2435 | 0.1513 | 0.7308 | 0.0067204 | 0.0070812 | 0.001495 | 22 | 20 | 22 | 19 | 132 | 169 | 161 | 132 | 118 | 13 | 13 | 943 | 1281 | 1928 | 1234 | 808 |
| Canada Goose | 577.82 | 249.06 | 12909.93 | 7257.7 | 115 | 22 | 15 | 21 | 57 | 22479.93 | 12816.81 | 0.5622 | 0.4054 | 0.234 | 0.1826 | 0.7215 | 0.0047824 | 0.005187 | 0.0006344 | 4 | 5 | 36 | 34 | 337 | 412 | 261 | 265 | 329 | 14 | 11 | 672 | 572 | 1980 | 814 | 871 |
| Allegra K | 14.35 | 6.76 | 20908.12 | 11061.0 | 6057 | 1467 | 610 | 943 | 3037 | 22396.3 | 11874.9 | 0.529 | 0.2937 | 0.2869 | 0.1557 | 0.6743 | 0.0077452 | 0.0079052 | 0.0334135 | 2442 | 2434 | 16 | 16 | 1 | 1 | 1 | 1 | 1 | 15 | 15 | 1172 | 1190 | 1384 | 1170 | 1255 |
Analytical Insights & Business Recommendations
Revenue vs. Profit Leadership Diverges: Diesel leads all brands in revenue ($53,774.81) but drops to #2 in profit ($27,000.80) due to a relatively low profit margin of 50.2%. Calvin Klein overtakes Diesel in profit ($28,267.04) despite ranking #2 in revenue, thanks to a stronger 53.3% margin. This divergence reveals that Diesel's higher average sale price ($138.24) comes with proportionally higher product costs ($68.92), compressing margins.
Recommendation: For high-revenue, lower-margin brands like Diesel, negotiate better supplier pricing given the volume leverage – 1,466 units ordered gives significant bargaining power. Even a 2–3% cost reduction on Diesel products would yield substantial additional profit given the revenue scale. Alternatively, since Diesel already commands premium pricing, explore whether modest price increases on best-selling Diesel items would be absorbed by demand without significant volume loss.
The North Face: Premium Pricing Power: The North Face ranks #11 in revenue ($25,174.88) but achieves this with only 233 unit orders – the fewest among the top 15 brands. Its average sale price of $440.81 is the highest by a wide margin (the next highest is True Religion at $196.17). This means The North Face extracts over 2x more revenue per unit than any comparable brand.
With a 54.5% profit margin and only 20 returns out of 81 completed/returned units (24.7% return rate – the lowest among top brands), The North Face represents the most efficient revenue-to-order ratio in the dataset.
Recommendation: Allocate increased internal inventory space and priority fulfillment to The North Face products. Their per-unit contribution is unmatched, and with the lowest return rate among top brands, each sale is highly likely to convert to retained revenue. Ensure stockouts never occur on The North Face items – lost sales on $440+ average items represent outsized opportunity cost.
Lost Revenue Leaders Mirror Revenue Leaders: The top brands by lost revenue are the same as the top brands by revenue – Diesel ($49,754.60 lost), Calvin Klein ($48,698.10), Carhartt ($41,134.22). This is expected since lost revenue scales with order volume and average price. However, the ratio of lost revenue to actual revenue is striking: Diesel loses $49K vs. earning $53K, meaning nearly half of all potential Diesel revenue evaporates through returns and cancellations.
Recommendation: For brands where lost revenue approaches or exceeds earned revenue, the cost of returns processing, reverse shipping, and restocking is a significant hidden expense. Investigate whether specific Diesel or Calvin Klein product lines disproportionately drive the returns, and target those SKUs for quality review or enhanced product descriptions rather than applying broad brand-level interventions.
Canada Goose: High Value, High Risk: Canada Goose stands out in the lost revenue table despite ranking #36 in revenue and #337 in unit orders. With only 115 orders placed, it generates $12,909.93 in revenue but $22,479.93 in lost revenue – nearly 2x what it actually earns. Its 40.5% return rate is the highest among brands appearing in the top 15 by lost profit.
Recommendation: Given Canada Goose's extremely high price point ($577.82 avg) and disproportionate loss ratio, this brand warrants a targeted investigation. With only 22 completed sales out of 115 orders, something systemic is driving cancellations and returns – possibly shipping delays on premium items, customer sticker shock after purchase, or quality/authenticity concerns. Consider whether the brand partnership is net-positive after accounting for return-processing costs on $500+ items.
Bottom Brands
Bottom brands by Profit Margin
WITH first_layer AS (
SELECT
  p.brand AS product_brand,
  ROUND(AVG(oi.sale_price), 2) AS avg_product_sale_price,
  ROUND(AVG(p.cost), 2) AS avg_product_cost,
ROUND(SUM(CASE WHEN oi.status = 'Complete' THEN oi.sale_price ELSE 0 END), 2) AS
revenue,
ROUND(SUM(CASE WHEN oi.status = 'Complete' THEN (oi.sale_price - p.cost) ELSE 0
END), 2) AS profit,
COUNT(*) AS unit_orders_placed,
SUM(CASE WHEN oi.status = 'Complete' THEN 1 ELSE 0 END) AS units_completed,
SUM(CASE WHEN oi.status = 'Returned' THEN 1 ELSE 0 END) AS units_returned,
SUM(CASE WHEN oi.status = 'Cancelled' THEN 1 ELSE 0 END) AS units_cancelled,
SUM(CASE WHEN oi.status IN ('Shipped', 'Processing') THEN 1 ELSE 0 END) AS units_en_route,
ROUND(SUM(CASE WHEN oi.status IN ('Returned', 'Cancelled') THEN oi.sale_price ELSE 0 END), 2) AS lost_revenue,
ROUND(SUM(CASE WHEN oi.status IN ('Returned', 'Cancelled') THEN (oi.sale_price - p.cost) ELSE 0 END), 2) AS lost_profit
FROM `bigquery-public-data.thelook_ecommerce.order_items` AS oi
JOIN `bigquery-public-data.thelook_ecommerce.orders` AS o
ON oi.order_id = o.order_id
JOIN `bigquery-public-data.thelook_ecommerce.products` AS p
ON oi.product_id = p.id
GROUP BY product_brand
),
second_layer AS (
SELECT
  *,
  ROUND((profit / NULLIF(revenue, 0)), 4) AS profit_margin,
  ROUND(units_returned / NULLIF(units_completed + units_returned, 0), 4) AS return_rate,
  ROUND(units_completed / NULLIF(unit_orders_placed - units_cancelled, 0), 4) AS completion_rate,
  ROUND(units_cancelled / NULLIF(unit_orders_placed, 0), 4) AS cancellation_rate,
  ROUND(units_en_route / NULLIF(unit_orders_placed - (units_cancelled + units_returned), 0), 4) AS en_route_rate,
  ROUND(revenue / SUM(revenue) OVER(), 7) AS revenue_share,
  ROUND(profit / SUM(profit) OVER(), 7) AS profit_share,
  ROUND(unit_orders_placed / SUM(unit_orders_placed) OVER(), 7) AS unit_orders_placed_share
FROM first_layer
)
, third_layer AS (
SELECT
  *,
  RANK() OVER(ORDER BY avg_product_sale_price DESC) AS avg_product_sale_price_rank,
  RANK() OVER(ORDER BY avg_product_cost DESC) AS avg_product_cost_rank,
  RANK() OVER(ORDER BY revenue DESC) AS revenue_rank,
  RANK() OVER(ORDER BY profit DESC) AS profit_rank,
  RANK() OVER(ORDER BY unit_orders_placed DESC) AS unit_orders_placed_rank,
  RANK() OVER(ORDER BY units_completed DESC) AS units_completed_rank,
  RANK() OVER(ORDER BY units_returned DESC) AS units_returned_rank,
  RANK() OVER(ORDER BY units_cancelled DESC) AS units_cancelled_rank,
  RANK() OVER(ORDER BY units_en_route DESC) AS units_en_route_rank,
  RANK() OVER(ORDER BY lost_revenue DESC) AS lost_revenue_rank,
  RANK() OVER(ORDER BY lost_profit DESC) AS lost_profit_rank,
  RANK() OVER(ORDER BY profit_margin DESC) AS profit_margin_rank,
  RANK() OVER(ORDER BY return_rate DESC) AS return_rate_rank,
  RANK() OVER(ORDER BY completion_rate DESC) AS completion_rate_rank,
  RANK() OVER(ORDER BY cancellation_rate DESC) AS cancellation_rate_rank,
  RANK() OVER(ORDER BY en_route_rate DESC) AS en_route_rate_rank
FROM second_layer
)
SELECT
	*
FROM third_layer
WHERE revenue_rank <= 50
ORDER BY
  profit_margin_rank DESC
LIMIT 15;| product_brand | avg_product_sale_price | avg_product_cost | revenue | profit | unit_orders_placed | units_completed | units_returned | units_cancelled | units_en_route | lost_revenue | lost_profit | profit_margin | return_rate | completion_rate | cancellation_rate | en_route_rate | revenue_share | profit_share | unit_orders_placed_share | avg_product_sale_price_rank | avg_product_cost_rank | revenue_rank | profit_rank | unit_orders_placed_rank | units_completed_rank | units_returned_rank | units_cancelled_rank | units_en_route_rank | lost_revenue_rank | lost_profit_rank | profit_margin_rank | return_rate_rank | completion_rate_rank | cancellation_rate_rank | en_route_rate_rank |
|---|---|---|---|---|---|---|---|---|---|---|---|---|---|---|---|---|---|---|---|---|---|---|---|---|---|---|---|---|---|---|---|---|---|---|---|
| O'Neill | 48.36 | 26.32 | 12853.97 | 5838.83 | 1056 | 266 | 105 | 166 | 519 | 12805.89 | 5826.98 | 0.4542 | 0.283 | 0.2989 | 0.1572 | 0.6611 | 0.004776 | 0.0041877 | 0.0058271 | 1121 | 966 | 40 | 49 | 21 | 20 | 20 | 19 | 21 | 36 | 45 | 2064 | 1275 | 1256 | 1152 | 1592 |
| Not Your Daughter's Jeans | 100.85 | 54.77 | 16067.86 | 7332.91 | 527 | 157 | 62 | 61 | 247 | 12591.86 | 5739.96 | 0.4564 | 0.2831 | 0.3369 | 0.1157 | 0.6114 | 0.0059701 | 0.0052593 | 0.002908 | 351 | 296 | 26 | 32 | 54 | 46 | 49 | 82 | 61 | 38 | 48 | 2039 | 1273 | 768 | 1797 | 1957 |
| Quiksilver | 61.96 | 33.3 | 27116.76 | 12559.81 | 1714 | 449 | 185 | 258 | 822 | 28245.96 | 13081.14 | 0.4632 | 0.2918 | 0.3084 | 0.1505 | 0.6467 | 0.0100755 | 0.0090081 | 0.009458 | 807 | 686 | 8 | 11 | 6 | 6 | 6 | 6 | 7 | 7 | 11 | 1969 | 1191 | 1129 | 1253 | 1694 |
| Hurley | 51.36 | 27.48 | 21510.02 | 9986.41 | 1580 | 417 | 163 | 218 | 782 | 19406.52 | 9038.59 | 0.4643 | 0.281 | 0.3062 | 0.138 | 0.6522 | 0.0079922 | 0.0071624 | 0.0087185 | 1028 | 911 | 15 | 19 | 10 | 8 | 8 | 13 | 9 | 19 | 23 | 1950 | 1282 | 1168 | 1482 | 1647 |
| Hudson | 175.32 | 92.88 | 10759.54 | 5042.67 | 238 | 59 | 22 | 36 | 121 | 9975.18 | 4637.96 | 0.4687 | 0.2716 | 0.2921 | 0.1513 | 0.6722 | 0.0039978 | 0.0036167 | 0.0013133 | 124 | 81 | 49 | 57 | 147 | 155 | 163 | 147 | 147 | 53 | 61 | 1890 | 1334 | 1311 | 1241 | 1291 |
| Wrangler | 42.74 | 22.6 | 12444.43 | 5840.02 | 1284 | 293 | 128 | 220 | 643 | 14851.87 | 6983.23 | 0.4693 | 0.304 | 0.2754 | 0.1713 | 0.687 | 0.0046238 | 0.0041886 | 0.0070852 | 1272 | 1178 | 43 | 48 | 14 | 15 | 14 | 12 | 14 | 32 | 34 | 1880 | 1126 | 1522 | 929 | 1182 |
| Joe's Jeans | 152.57 | 80.56 | 24447.28 | 11502.21 | 680 | 161 | 61 | 112 | 346 | 26495.04 | 12836.04 | 0.4705 | 0.2748 | 0.2835 | 0.1647 | 0.6824 | 0.0090836 | 0.0082496 | 0.0037523 | 163 | 127 | 10 | 14 | 42 | 43 | 52 | 38 | 40 | 9 | 13 | 1861 | 1308 | 1444 | 1079 | 1212 |
| True Religion | 202.86 | 106.23 | 41113.02 | 19519.17 | 849 | 195 | 93 | 126 | 435 | 45038.92 | 21465.47 | 0.4748 | 0.3229 | 0.2697 | 0.1484 | 0.6905 | 0.0152759 | 0.0139995 | 0.0046848 | 83 | 51 | 5 | 5 | 32 | 34 | 30 | 32 | 30 | 3 | 4 | 1810 | 1044 | 1573 | 1285 | 1144 |
| 7 For All Mankind | 157.7 | 82.42 | 43657.56 | 20989.88 | 1108 | 271 | 99 | 168 | 570 | 41942.75 | 19952.86 | 0.4808 | 0.2676 | 0.2883 | 0.1516 | 0.6778 | 0.0162213 | 0.0150543 | 0.006114 | 151 | 118 | 3 | 4 | 19 | 18 | 24 | 18 | 18 | 5 | 5 | 1730 | 1349 | 1336 | 1234 | 1251 |
| Lucky Brand | 72.72 | 37.91 | 20488.7 | 9871.63 | 1073 | 289 | 92 | 157 | 535 | 18560.05 | 8803.71 | 0.4818 | 0.2415 | 0.3155 | 0.1463 | 0.6493 | 0.0076127 | 0.0070801 | 0.0059209 | 631 | 548 | 17 | 21 | 20 | 16 | 31 | 21 | 20 | 21 | 25 | 1719 | 1590 | 1077 | 1319 | 1673 |
| AG Adriano Goldschmied | 158.52 | 81.45 | 15325.0 | 7390.13 | 353 | 96 | 35 | 43 | 179 | 12419.86 | 6058.66 | 0.4822 | 0.2672 | 0.3097 | 0.1218 | 0.6509 | 0.0056941 | 0.0053003 | 0.0019479 | 149 | 121 | 30 | 30 | 100 | 84 | 102 | 126 | 93 | 40 | 40 | 1713 | 1351 | 1123 | 1739 | 1660 |
| DC | 50.94 | 25.91 | 14076.31 | 6883.92 | 966 | 263 | 101 | 148 | 454 | 12578.25 | 6213.14 | 0.489 | 0.2775 | 0.3215 | 0.1532 | 0.6332 | 0.0052302 | 0.0049373 | 0.0053304 | 1036 | 990 | 32 | 37 | 25 | 22 | 22 | 24 | 26 | 39 | 39 | 1628 | 1299 | 1027 | 1219 | 1811 |
| Volcom | 59.28 | 29.98 | 31207.34 | 15349.94 | 1914 | 521 | 192 | 271 | 930 | 28218.2 | 13987.51 | 0.4919 | 0.2693 | 0.3171 | 0.1416 | 0.6409 | 0.0115953 | 0.0110093 | 0.0105616 | 868 | 801 | 6 | 7 | 5 | 4 | 5 | 5 | 5 | 8 | 8 | 1601 | 1341 | 1058 | 1448 | 1747 |
| Nike | 80.59 | 40.35 | 16424.08 | 8174.99 | 520 | 125 | 44 | 76 | 275 | 7304.66 | 3876.47 | 0.4977 | 0.2604 | 0.2815 | 0.1462 | 0.6875 | 0.0061025 | 0.0058633 | 0.0028694 | 531 | 487 | 25 | 28 | 55 | 56 | 73 | 63 | 50 | 76 | 73 | 1534 | 1384 | 1460 | 1321 | 1169 |
| Levi's | 50.16 | 25.28 | 21140.97 | 10560.39 | 1583 | 418 | 172 | 238 | 755 | 20050.17 | 9823.1 | 0.4995 | 0.2915 | 0.3108 | 0.1503 | 0.6436 | 0.0078551 | 0.0075741 | 0.0087351 | 1053 | 1019 | 16 | 16 | 9 | 7 | 7 | 9 | 11 | 18 | 19 | 1502 | 1195 | 1112 | 1255 | 1713 |
Bottom brands by Unit Orders
WITH first_layer AS (
SELECT
  p.brand AS product_brand,
  ROUND(AVG(oi.sale_price), 2) AS avg_product_sale_price,
  ROUND(AVG(p.cost), 2) AS avg_product_cost,
ROUND(SUM(CASE WHEN oi.status = 'Complete' THEN oi.sale_price ELSE 0 END), 2) AS
revenue,
ROUND(SUM(CASE WHEN oi.status = 'Complete' THEN (oi.sale_price - p.cost) ELSE 0
END), 2) AS profit,
COUNT(*) AS unit_orders_placed,
SUM(CASE WHEN oi.status = 'Complete' THEN 1 ELSE 0 END) AS units_completed,
SUM(CASE WHEN oi.status = 'Returned' THEN 1 ELSE 0 END) AS units_returned,
SUM(CASE WHEN oi.status = 'Cancelled' THEN 1 ELSE 0 END) AS units_cancelled,
SUM(CASE WHEN oi.status IN ('Shipped', 'Processing') THEN 1 ELSE 0 END) AS units_en_route,
ROUND(SUM(CASE WHEN oi.status IN ('Returned', 'Cancelled') THEN oi.sale_price ELSE 0 END), 2) AS lost_revenue,
ROUND(SUM(CASE WHEN oi.status IN ('Returned', 'Cancelled') THEN (oi.sale_price - p.cost) ELSE 0 END), 2) AS lost_profit
FROM `bigquery-public-data.thelook_ecommerce.order_items` AS oi
JOIN `bigquery-public-data.thelook_ecommerce.orders` AS o
ON oi.order_id = o.order_id
JOIN `bigquery-public-data.thelook_ecommerce.products` AS p
ON oi.product_id = p.id
GROUP BY product_brand
),
second_layer AS (
SELECT
  *,
  ROUND((profit / NULLIF(revenue, 0)), 4) AS profit_margin,
  ROUND(units_returned / NULLIF(units_completed + units_returned, 0), 4) AS return_rate,
  ROUND(units_completed / NULLIF(unit_orders_placed - units_cancelled, 0), 4) AS completion_rate,
  ROUND(units_cancelled / NULLIF(unit_orders_placed, 0), 4) AS cancellation_rate,
  ROUND(units_en_route / NULLIF(unit_orders_placed - (units_cancelled + units_returned), 0), 4) AS en_route_rate,
  ROUND(revenue / SUM(revenue) OVER(), 7) AS revenue_share,
  ROUND(profit / SUM(profit) OVER(), 7) AS profit_share,
  ROUND(unit_orders_placed / SUM(unit_orders_placed) OVER(), 7) AS unit_orders_placed_share
FROM first_layer
)
SELECT
  *,
  RANK() OVER(ORDER BY avg_product_sale_price DESC) AS avg_product_sale_price_rank,
  RANK() OVER(ORDER BY avg_product_cost DESC) AS avg_product_cost_rank,
  RANK() OVER(ORDER BY revenue DESC) AS revenue_rank,
  RANK() OVER(ORDER BY profit DESC) AS profit_rank,
  RANK() OVER(ORDER BY unit_orders_placed DESC) AS unit_orders_placed_rank,
  RANK() OVER(ORDER BY units_completed DESC) AS units_completed_rank,
  RANK() OVER(ORDER BY units_returned DESC) AS units_returned_rank,
  RANK() OVER(ORDER BY units_cancelled DESC) AS units_cancelled_rank,
  RANK() OVER(ORDER BY units_en_route DESC) AS units_en_route_rank,
  RANK() OVER(ORDER BY lost_revenue DESC) AS lost_revenue_rank,
  RANK() OVER(ORDER BY lost_profit DESC) AS lost_profit_rank,
  RANK() OVER(ORDER BY profit_margin DESC) AS profit_margin_rank,
  RANK() OVER(ORDER BY return_rate DESC) AS return_rate_rank,
  RANK() OVER(ORDER BY completion_rate DESC) AS completion_rate_rank,
  RANK() OVER(ORDER BY cancellation_rate DESC) AS cancellation_rate_rank,
  RANK() OVER(ORDER BY en_route_rate DESC) AS en_route_rate_rank
FROM second_layer
ORDER BY
  unit_orders_placed_rank DESC
LIMIT 15;| product_brand | avg_product_sale_price | avg_product_cost | revenue | profit | unit_orders_placed | units_completed | units_returned | units_cancelled | units_en_route | lost_revenue | lost_profit | profit_margin | return_rate | completion_rate | cancellation_rate | en_route_rate | revenue_share | profit_share | unit_orders_placed_share | avg_product_sale_price_rank | avg_product_cost_rank | revenue_rank | profit_rank | unit_orders_placed_rank | units_completed_rank | units_returned_rank | units_cancelled_rank | units_en_route_rank | lost_revenue_rank | lost_profit_rank | profit_margin_rank | return_rate_rank | completion_rate_rank | cancellation_rate_rank | en_route_rate_rank |
|---|---|---|---|---|---|---|---|---|---|---|---|---|---|---|---|---|---|---|---|---|---|---|---|---|---|---|---|---|---|---|---|---|---|---|---|
| Versace | 128.5 | 57.7 | 0.0 | 0.0 | 1 | 0 | 1 | 0 | 0 | 128.5 | 70.8 | 1.0 | 0.0 | 0.0 | 0.0 | 0.0 | 5.5e-06 | 234 | 265 | 2518 | 2518 | 2742 | 2518 | 1457 | 2284 | 2713 | 1528 | 1482 | 2518 | 1 | 2518 | 2284 | 2743 | ||
| Hermanny | 62.99 | 25.13 | 0.0 | 0.0 | 1 | 0 | 1 | 0 | 0 | 62.99 | 37.86 | 1.0 | 0.0 | 0.0 | 0.0 | 0.0 | 5.5e-06 | 796 | 1030 | 2518 | 2518 | 2742 | 2518 | 1457 | 2284 | 2713 | 1945 | 1840 | 2518 | 1 | 2518 | 2284 | 2743 | ||
| Danshuz | 12.0 | 5.23 | 0.0 | 0.0 | 1 | 0 | 0 | 1 | 0 | 12.0 | 6.77 | 1.0 | 0.0 | 0.0 | 5.5e-06 | 2529 | 2569 | 2518 | 2518 | 2742 | 2518 | 2066 | 1744 | 2713 | 2439 | 2427 | 2518 | 2624 | 2752 | 1 | 2743 | ||||
| Soft-Fit | 19.99 | 12.99 | 0.0 | 0.0 | 1 | 0 | 0 | 1 | 0 | 19.99 | 7.0 | 1.0 | 0.0 | 0.0 | 5.5e-06 | 2156 | 1841 | 2518 | 2518 | 2742 | 2518 | 2066 | 1744 | 2713 | 2356 | 2423 | 2518 | 2624 | 2752 | 1 | 2743 | ||||
| Trenway Textiles | 5.2 | 3.28 | 5.2 | 1.92 | 1 | 1 | 0 | 0 | 0 | 0.0 | 0.0 | 0.3692 | 0.0 | 1.0 | 0.0 | 0.0 | 1.9e-06 | 1.4e-06 | 5.5e-06 | 2719 | 2683 | 2508 | 2511 | 2742 | 2114 | 2066 | 2284 | 2713 | 2499 | 2499 | 2495 | 2066 | 1 | 2284 | 2713 |
| TAIGA | 80.95 | 35.21 | 0.0 | 0.0 | 1 | 0 | 0 | 1 | 0 | 80.95 | 45.74 | 1.0 | 0.0 | 0.0 | 5.5e-06 | 530 | 626 | 2518 | 2518 | 2742 | 2518 | 2066 | 1744 | 2713 | 1773 | 1726 | 2518 | 2624 | 2752 | 1 | 2743 | ||||
| NCIS | 18.95 | 7.88 | 0.0 | 0.0 | 1 | 0 | 0 | 0 | 1 | 0.0 | 0.0 | 0.0 | 0.0 | 1.0 | 0.0 | 0.0 | 5.5e-06 | 2238 | 2335 | 2518 | 2518 | 2742 | 2518 | 2066 | 2284 | 2575 | 2499 | 2499 | 2518 | 2624 | 2518 | 2284 | 1 | ||
| Steel Paisley | 120.0 | 48.72 | 120.0 | 71.28 | 1 | 1 | 0 | 0 | 0 | 0.0 | 0.0 | 0.594 | 0.0 | 1.0 | 0.0 | 0.0 | 4.46e-05 | 5.11e-05 | 5.5e-06 | 264 | 351 | 1535 | 1448 | 2742 | 2114 | 2066 | 2284 | 2713 | 2499 | 2499 | 269 | 2066 | 1 | 2284 | 2713 |
| marshal | 0.02 | 0.01 | 0.0 | 0.0 | 1 | 0 | 0 | 0 | 1 | 0.0 | 0.0 | 0.0 | 0.0 | 1.0 | 0.0 | 0.0 | 5.5e-06 | 2755 | 2755 | 2518 | 2518 | 2742 | 2518 | 2066 | 2284 | 2575 | 2499 | 2499 | 2518 | 2624 | 2518 | 2284 | 1 | ||
| EuroBrand | 14.99 | 7.32 | 0.0 | 0.0 | 1 | 0 | 1 | 0 | 0 | 14.99 | 7.67 | 1.0 | 0.0 | 0.0 | 0.0 | 0.0 | 5.5e-06 | 2395 | 2393 | 2518 | 2518 | 2742 | 2518 | 1457 | 2284 | 2713 | 2410 | 2411 | 2518 | 1 | 2518 | 2284 | 2743 | ||
| FREEGUN | 12.95 | 6.27 | 0.0 | 0.0 | 1 | 0 | 0 | 0 | 1 | 0.0 | 0.0 | 0.0 | 0.0 | 1.0 | 0.0 | 0.0 | 5.5e-06 | 2503 | 2478 | 2518 | 2518 | 2742 | 2518 | 2066 | 2284 | 2575 | 2499 | 2499 | 2518 | 2624 | 2518 | 2284 | 1 | ||
| Easy Expression | 29.99 | 12.39 | 0.0 | 0.0 | 1 | 0 | 0 | 0 | 1 | 0.0 | 0.0 | 0.0 | 0.0 | 1.0 | 0.0 | 0.0 | 5.5e-06 | 1683 | 1919 | 2518 | 2518 | 2742 | 2518 | 2066 | 2284 | 2575 | 2499 | 2499 | 2518 | 2624 | 2518 | 2284 | 1 | ||
| VIP FASHION | 15.99 | 6.54 | 0.0 | 0.0 | 1 | 0 | 0 | 0 | 1 | 0.0 | 0.0 | 0.0 | 0.0 | 1.0 | 0.0 | 0.0 | 5.5e-06 | 2343 | 2452 | 2518 | 2518 | 2742 | 2518 | 2066 | 2284 | 2575 | 2499 | 2499 | 2518 | 2624 | 2518 | 2284 | 1 | ||
| Xscape | 46.46 | 17.19 | 0.0 | 0.0 | 1 | 0 | 0 | 0 | 1 | 0.0 | 0.0 | 0.0 | 0.0 | 1.0 | 0.0 | 0.0 | 5.5e-06 | 1163 | 1490 | 2518 | 2518 | 2742 | 2518 | 2066 | 2284 | 2575 | 2499 | 2499 | 2518 | 2624 | 2518 | 2284 | 1 | ||
| C & C California | 44.0 | 26.58 | 0.0 | 0.0 | 2 | 0 | 0 | 1 | 1 | 44.0 | 17.42 | 0.0 | 0.5 | 1.0 | 0.0 | 0.0 | 1.1e-05 | 1226 | 955 | 2518 | 2518 | 2686 | 2518 | 2066 | 1744 | 2575 | 2127 | 2219 | 2518 | 2624 | 2518 | 19 | 1 |
Analytical Insights & Business Recommendations
The lowest profit margins among top-50 revenue brands are O'Neill (45.4%), Not Your Daughter's Jeans (45.6%), Quiksilver (45.6%), and Hurley (46.4%). These are overwhelmingly surf/action sports and denim brands where product costs consume a larger share of the sale price. The denim brands specifically (True Religion at 47.5%, 7 For All Mankind at 47.5%, Joe's Jeans at 47.1%, Hudson at 46.9%) all cluster in the 46–48% margin range, suggesting that denim as a product type carries higher input costs industry-wide. Given that denim margins are structurally lower, cost reduction is the primary lever. With brands like Wrangler (1,284 orders), Levi's (1,555 orders), and 7 For All Mankind (1,086 orders) driving substantial volume, negotiate volume-based supplier discounts. The order quantities provide real leverage – present suppliers with the choice of better unit pricing or reduced shelf allocation in favor of higher-margin categories.
The bottom 15 brands by unit orders all have just 1 order placed (Versace, Hermanny, Danshuz, Soft-Fit, TAIGA, NCIS, EuroBrand, FREEGUN, etc.). Most generated $0 in revenue – their only orders were returned or cancelled. These brands collectively represent dead inventory and wasted catalog space. Several of these brands (Versace with $128.50 avg price, TAIGA at $80.95, Steel Paisley at $120.00) carry higher price points, meaning each failed order ties up more capital in unsold inventory. Brands with fewer than 5 lifetime orders and $0 completed revenue should be evaluated for removal. Maintaining supplier relationships, inventory allocations, and product listings for brands that generate no revenue is a net drain on operational resources. Consider stopping deals with these underperforming brands to free up bandwidth and inventory space for proven performers. These brands may also be negatively affecting the company's reputation if customers encounter low-quality products from unknown suppliers.
Some bottom-volume brands show strong margins and clean loss profiles when they do complete sales. VIPARO (12 orders, $759.80 revenue, 54.5% margin, 0 returns) and Fisherman (9 orders, $596 revenue, 52.6% margin, 0 returns) demonstrate that small brands can perform well when their products connect with buyers. Rather than dropping all low-volume brands indiscriminately, identify the ones with strong margins, zero returns, and reasonable completion rates. These brands may be underperforming due to lack of visibility rather than product quality issues. Targeted promotion through category-specific advertising or "featured new brand" placements could surface these hidden gems to a wider audience and test whether increased exposure drives proportional sales growth.
Top Categories
Top categories by Revenue
WITH first_layer AS (
SELECT
  p.category AS product_category,
  ROUND(AVG(oi.sale_price), 2) AS avg_product_sale_price,
  ROUND(AVG(p.cost), 2) AS avg_product_cost,
ROUND(SUM(CASE WHEN oi.status = 'Complete' THEN oi.sale_price ELSE 0 END), 2) AS
revenue,
ROUND(SUM(CASE WHEN oi.status = 'Complete' THEN (oi.sale_price - p.cost) ELSE 0
END), 2) AS profit,
COUNT(*) AS unit_orders_placed,
SUM(CASE WHEN oi.status = 'Complete' THEN 1 ELSE 0 END) AS units_completed,
SUM(CASE WHEN oi.status = 'Returned' THEN 1 ELSE 0 END) AS units_returned,
SUM(CASE WHEN oi.status = 'Cancelled' THEN 1 ELSE 0 END) AS units_cancelled,
SUM(CASE WHEN oi.status IN ('Shipped', 'Processing') THEN 1 ELSE 0 END) AS units_en_route,
ROUND(SUM(CASE WHEN oi.status IN ('Returned', 'Cancelled') THEN oi.sale_price ELSE 0 END), 2) AS lost_revenue,
ROUND(SUM(CASE WHEN oi.status IN ('Returned', 'Cancelled') THEN (oi.sale_price - p.cost) ELSE 0 END), 2) AS lost_profit
FROM `bigquery-public-data.thelook_ecommerce.order_items` AS oi
JOIN `bigquery-public-data.thelook_ecommerce.orders` AS o
ON oi.order_id = o.order_id
JOIN `bigquery-public-data.thelook_ecommerce.products` AS p
ON oi.product_id = p.id
GROUP BY product_category
),
second_layer AS (
SELECT
  *,
  ROUND((profit / NULLIF(revenue, 0)), 4) AS profit_margin,
  ROUND(units_returned / NULLIF(units_completed + units_returned, 0), 4) AS return_rate,
  ROUND(units_completed / NULLIF(unit_orders_placed - units_cancelled, 0), 4) AS completion_rate,
  ROUND(units_cancelled / NULLIF(unit_orders_placed, 0), 4) AS cancellation_rate,
  ROUND(units_en_route / NULLIF(unit_orders_placed - (units_cancelled + units_returned), 0), 4) AS en_route_rate,
  ROUND(revenue / SUM(revenue) OVER(), 7) AS revenue_share,
  ROUND(profit / SUM(profit) OVER(), 7) AS profit_share,
  ROUND(unit_orders_placed / SUM(unit_orders_placed) OVER(), 7) AS unit_orders_placed_share
FROM first_layer
)
SELECT
  *,
  RANK() OVER(ORDER BY avg_product_sale_price DESC) AS avg_product_sale_price_rank,
  RANK() OVER(ORDER BY avg_product_cost DESC) AS avg_product_cost_rank,
  RANK() OVER(ORDER BY revenue DESC) AS revenue_rank,
  RANK() OVER(ORDER BY profit DESC) AS profit_rank,
  RANK() OVER(ORDER BY unit_orders_placed DESC) AS unit_orders_placed_rank,
  RANK() OVER(ORDER BY units_completed DESC) AS units_completed_rank,
  RANK() OVER(ORDER BY units_returned DESC) AS units_returned_rank,
  RANK() OVER(ORDER BY units_cancelled DESC) AS units_cancelled_rank,
  RANK() OVER(ORDER BY units_en_route DESC) AS units_en_route_rank,
  RANK() OVER(ORDER BY lost_revenue DESC) AS lost_revenue_rank,
  RANK() OVER(ORDER BY lost_profit DESC) AS lost_profit_rank,
  RANK() OVER(ORDER BY profit_margin DESC) AS profit_margin_rank,
  RANK() OVER(ORDER BY return_rate DESC) AS return_rate_rank,
  RANK() OVER(ORDER BY completion_rate DESC) AS completion_rate_rank,
  RANK() OVER(ORDER BY cancellation_rate DESC) AS cancellation_rate_rank,
  RANK() OVER(ORDER BY en_route_rate DESC) AS en_route_rate_rank
FROM second_layer
ORDER BY
  revenue_rank ASC
LIMIT 15;| product_category | avg_product_sale_price | avg_product_cost | revenue | profit | unit_orders_placed | units_completed | units_returned | units_cancelled | units_en_route | lost_revenue | lost_profit | profit_margin | return_rate | completion_rate | cancellation_rate | en_route_rate | revenue_share | profit_share | unit_orders_placed_share | avg_product_sale_price_rank | avg_product_cost_rank | revenue_rank | profit_rank | unit_orders_placed_rank | units_completed_rank | units_returned_rank | units_cancelled_rank | units_en_route_rank | lost_revenue_rank | lost_profit_rank | profit_margin_rank | return_rate_rank | completion_rate_rank | cancellation_rate_rank | en_route_rate_rank |
|---|---|---|---|---|---|---|---|---|---|---|---|---|---|---|---|---|---|---|---|---|---|---|---|---|---|---|---|---|---|---|---|---|---|---|---|
| Outerwear & Coats | 146.29 | 65.02 | 339222.29 | 188050.56 | 9028 | 2308 | 862 | 1318 | 4540 | 322743.18 | 179542.92 | 0.5544 | 0.2719 | 0.2994 | 0.146 | 0.663 | 0.1260408 | 0.1348735 | 0.0498171 | 1 | 2 | 1 | 1 | 10 | 10 | 11 | 11 | 10 | 1 | 1 | 8 | 26 | 4 | 23 | 19 |
| Jeans | 97.76 | 52.34 | 308764.08 | 143520.48 | 12655 | 3169 | 1303 | 1955 | 6228 | 319052.52 | 148299.49 | 0.4648 | 0.2914 | 0.2962 | 0.1545 | 0.6628 | 0.1147238 | 0.1029357 | 0.0698311 | 4 | 4 | 2 | 2 | 2 | 2 | 2 | 2 | 2 | 2 | 2 | 21 | 9 | 9 | 3 | 20 |
| Sweaters | 75.46 | 36.32 | 213600.63 | 110714.83 | 11078 | 2792 | 1081 | 1688 | 5517 | 208115.59 | 107697.32 | 0.5183 | 0.2791 | 0.2973 | 0.1524 | 0.664 | 0.0793651 | 0.0794068 | 0.0611291 | 8 | 7 | 3 | 3 | 7 | 6 | 8 | 6 | 8 | 3 | 3 | 12 | 22 | 6 | 8 | 18 |
| Swim | 57.2 | 28.98 | 156523.7 | 76716.71 | 11246 | 2772 | 1143 | 1660 | 5671 | 159217.24 | 78510.83 | 0.4901 | 0.292 | 0.2892 | 0.1476 | 0.6717 | 0.0581577 | 0.0550227 | 0.0620561 | 10 | 10 | 4 | 5 | 5 | 7 | 5 | 7 | 5 | 6 | 5 | 16 | 7 | 17 | 22 | 10 |
| Fashion Hoodies & Sweatshirts | 54.02 | 28.09 | 155933.0 | 74918.07 | 11737 | 2951 | 1191 | 1714 | 5881 | 159794.53 | 76980.63 | 0.4805 | 0.2875 | 0.2944 | 0.146 | 0.6659 | 0.0579382 | 0.0537327 | 0.0647655 | 12 | 11 | 5 | 6 | 4 | 4 | 4 | 4 | 4 | 5 | 6 | 17 | 14 | 12 | 23 | 14 |
| Suits & Sport Coats | 124.74 | 50.03 | 153543.45 | 92034.55 | 5176 | 1255 | 486 | 790 | 2645 | 160577.15 | 96066.37 | 0.5994 | 0.2791 | 0.2861 | 0.1526 | 0.6782 | 0.0570503 | 0.066009 | 0.0285615 | 2 | 5 | 6 | 4 | 16 | 16 | 17 | 16 | 16 | 4 | 4 | 2 | 22 | 23 | 5 | 2 |
| Shorts | 47.29 | 23.69 | 136510.82 | 68155.43 | 11176 | 2819 | 1130 | 1690 | 5537 | 134644.7 | 67078.36 | 0.4993 | 0.2861 | 0.2972 | 0.1512 | 0.6626 | 0.0507217 | 0.0488824 | 0.0616699 | 17 | 14 | 7 | 9 | 6 | 5 | 6 | 5 | 7 | 7 | 8 | 14 | 15 | 7 | 10 | 21 |
| Sleep & Lounge | 48.79 | 23.64 | 132101.2 | 68241.52 | 11071 | 2737 | 1128 | 1645 | 5561 | 134573.41 | 68950.32 | 0.5166 | 0.2918 | 0.2904 | 0.1486 | 0.6702 | 0.0490833 | 0.0489441 | 0.0610905 | 16 | 15 | 8 | 8 | 8 | 8 | 7 | 8 | 6 | 8 | 7 | 13 | 8 | 15 | 15 | 12 |
| Tops & Tees | 40.97 | 22.93 | 121151.89 | 53364.7 | 12000 | 2960 | 1292 | 1783 | 5965 | 123378.82 | 54313.77 | 0.4405 | 0.3039 | 0.2897 | 0.1486 | 0.6683 | 0.045015 | 0.0382742 | 0.0662168 | 20 | 16 | 9 | 14 | 3 | 3 | 3 | 3 | 3 | 9 | 13 | 22 | 2 | 16 | 15 | 13 |
| Intimates | 33.75 | 17.96 | 118381.2 | 55321.28 | 13423 | 3393 | 1329 | 2044 | 6657 | 112421.97 | 52618.74 | 0.4673 | 0.2814 | 0.2982 | 0.1523 | 0.6624 | 0.0439855 | 0.0396775 | 0.074069 | 22 | 21 | 10 | 13 | 1 | 1 | 1 | 1 | 1 | 12 | 14 | 20 | 19 | 5 | 9 | 23 |
| Active | 50.94 | 21.35 | 117645.45 | 68332.26 | 8932 | 2180 | 938 | 1362 | 4452 | 113272.89 | 66015.46 | 0.5808 | 0.3008 | 0.288 | 0.1525 | 0.6713 | 0.0437121 | 0.0490092 | 0.0492873 | 15 | 18 | 11 | 7 | 11 | 11 | 10 | 10 | 11 | 10 | 9 | 6 | 4 | 21 | 7 | 11 |
| Dresses | 84.24 | 37.9 | 112895.24 | 62082.56 | 5358 | 1316 | 549 | 792 | 2701 | 113022.02 | 62283.44 | 0.5499 | 0.2944 | 0.2882 | 0.1478 | 0.6724 | 0.0419471 | 0.0445268 | 0.0295658 | 7 | 6 | 12 | 10 | 15 | 15 | 15 | 15 | 15 | 11 | 10 | 9 | 6 | 20 | 21 | 9 |
| Pants | 59.65 | 27.35 | 106719.7 | 57634.8 | 7239 | 1823 | 713 | 1076 | 3627 | 106167.82 | 57611.26 | 0.5401 | 0.2812 | 0.2958 | 0.1486 | 0.6655 | 0.0396526 | 0.0413368 | 0.0399453 | 9 | 12 | 13 | 12 | 13 | 13 | 13 | 13 | 13 | 13 | 12 | 10 | 21 | 10 | 15 | 16 |
| Accessories | 42.05 | 16.85 | 99096.96 | 59262.83 | 9813 | 2384 | 967 | 1497 | 4965 | 103385.5 | 62000.28 | 0.598 | 0.2886 | 0.2867 | 0.1526 | 0.6756 | 0.0368203 | 0.0425044 | 0.0541488 | 19 | 22 | 14 | 11 | 9 | 9 | 9 | 9 | 9 | 14 | 11 | 5 | 12 | 22 | 5 | 5 |
| Blazers & Jackets | 90.68 | 34.35 | 65986.31 | 40954.92 | 3194 | 745 | 334 | 506 | 1609 | 76039.51 | 47305.1 | 0.6207 | 0.3095 | 0.2772 | 0.1584 | 0.6835 | 0.0245178 | 0.0293737 | 0.0176247 | 5 | 8 | 15 | 15 | 22 | 22 | 22 | 20 | 21 | 15 | 15 | 1 | 1 | 26 | 1 | 1 |
Top categories by Profit Margin
WITH first_layer AS (
SELECT
  p.category AS product_category,
  ROUND(AVG(oi.sale_price), 2) AS avg_product_sale_price,
  ROUND(AVG(p.cost), 2) AS avg_product_cost,
ROUND(SUM(CASE WHEN oi.status = 'Complete' THEN oi.sale_price ELSE 0 END), 2) AS
revenue,
ROUND(SUM(CASE WHEN oi.status = 'Complete' THEN (oi.sale_price - p.cost) ELSE 0
END), 2) AS profit,
COUNT(*) AS unit_orders_placed,
SUM(CASE WHEN oi.status = 'Complete' THEN 1 ELSE 0 END) AS units_completed,
SUM(CASE WHEN oi.status = 'Returned' THEN 1 ELSE 0 END) AS units_returned,
SUM(CASE WHEN oi.status = 'Cancelled' THEN 1 ELSE 0 END) AS units_cancelled,
SUM(CASE WHEN oi.status IN ('Shipped', 'Processing') THEN 1 ELSE 0 END) AS units_en_route,
ROUND(SUM(CASE WHEN oi.status IN ('Returned', 'Cancelled') THEN oi.sale_price ELSE 0 END), 2) AS lost_revenue,
ROUND(SUM(CASE WHEN oi.status IN ('Returned', 'Cancelled') THEN (oi.sale_price - p.cost) ELSE 0 END), 2) AS lost_profit
FROM `bigquery-public-data.thelook_ecommerce.order_items` AS oi
JOIN `bigquery-public-data.thelook_ecommerce.orders` AS o
ON oi.order_id = o.order_id
JOIN `bigquery-public-data.thelook_ecommerce.products` AS p
ON oi.product_id = p.id
GROUP BY product_category
),
second_layer AS (
SELECT
  *,
  ROUND((profit / NULLIF(revenue, 0)), 4) AS profit_margin,
  ROUND(units_returned / NULLIF(units_completed + units_returned, 0), 4) AS return_rate,
  ROUND(units_completed / NULLIF(unit_orders_placed - units_cancelled, 0), 4) AS completion_rate,
  ROUND(units_cancelled / NULLIF(unit_orders_placed, 0), 4) AS cancellation_rate,
  ROUND(units_en_route / NULLIF(unit_orders_placed - (units_cancelled + units_returned), 0), 4) AS en_route_rate,
  ROUND(revenue / SUM(revenue) OVER(), 7) AS revenue_share,
  ROUND(profit / SUM(profit) OVER(), 7) AS profit_share,
  ROUND(unit_orders_placed / SUM(unit_orders_placed) OVER(), 7) AS unit_orders_placed_share
FROM first_layer
)
SELECT
  *,
  RANK() OVER(ORDER BY avg_product_sale_price DESC) AS avg_product_sale_price_rank,
  RANK() OVER(ORDER BY avg_product_cost DESC) AS avg_product_cost_rank,
  RANK() OVER(ORDER BY revenue DESC) AS revenue_rank,
  RANK() OVER(ORDER BY profit DESC) AS profit_rank,
  RANK() OVER(ORDER BY unit_orders_placed DESC) AS unit_orders_placed_rank,
  RANK() OVER(ORDER BY units_completed DESC) AS units_completed_rank,
  RANK() OVER(ORDER BY units_returned DESC) AS units_returned_rank,
  RANK() OVER(ORDER BY units_cancelled DESC) AS units_cancelled_rank,
  RANK() OVER(ORDER BY units_en_route DESC) AS units_en_route_rank,
  RANK() OVER(ORDER BY lost_revenue DESC) AS lost_revenue_rank,
  RANK() OVER(ORDER BY lost_profit DESC) AS lost_profit_rank,
  RANK() OVER(ORDER BY profit_margin DESC) AS profit_margin_rank,
  RANK() OVER(ORDER BY return_rate DESC) AS return_rate_rank,
  RANK() OVER(ORDER BY completion_rate DESC) AS completion_rate_rank,
  RANK() OVER(ORDER BY cancellation_rate DESC) AS cancellation_rate_rank,
  RANK() OVER(ORDER BY en_route_rate DESC) AS en_route_rate_rank
FROM second_layer
ORDER BY
  profit_margin_rank ASC
LIMIT 15;| product_category | avg_product_sale_price | avg_product_cost | revenue | profit | unit_orders_placed | units_completed | units_returned | units_cancelled | units_en_route | lost_revenue | lost_profit | profit_margin | return_rate | completion_rate | cancellation_rate | en_route_rate | revenue_share | profit_share | unit_orders_placed_share | avg_product_sale_price_rank | avg_product_cost_rank | revenue_rank | profit_rank | unit_orders_placed_rank | units_completed_rank | units_returned_rank | units_cancelled_rank | units_en_route_rank | lost_revenue_rank | lost_profit_rank | profit_margin_rank | return_rate_rank | completion_rate_rank | cancellation_rate_rank | en_route_rate_rank |
|---|---|---|---|---|---|---|---|---|---|---|---|---|---|---|---|---|---|---|---|---|---|---|---|---|---|---|---|---|---|---|---|---|---|---|---|
| Blazers & Jackets | 90.68 | 34.35 | 65986.31 | 40954.92 | 3194 | 745 | 334 | 506 | 1609 | 76039.51 | 47305.1 | 0.6207 | 0.3095 | 0.2772 | 0.1584 | 0.6835 | 0.0245178 | 0.0293737 | 0.0176247 | 5 | 8 | 15 | 15 | 22 | 22 | 22 | 20 | 21 | 15 | 15 | 1 | 1 | 26 | 1 | 1 |
| Suits & Sport Coats | 124.74 | 50.03 | 153543.45 | 92034.55 | 5176 | 1255 | 486 | 790 | 2645 | 160577.15 | 96066.37 | 0.5994 | 0.2791 | 0.2861 | 0.1526 | 0.6782 | 0.0570503 | 0.066009 | 0.0285615 | 2 | 5 | 6 | 4 | 16 | 16 | 17 | 16 | 16 | 4 | 4 | 2 | 22 | 23 | 5 | 2 |
| Socks & Hosiery | 16.81 | 6.75 | 15695.27 | 9398.63 | 3821 | 929 | 372 | 566 | 1954 | 15784.16 | 9453.9 | 0.5988 | 0.2859 | 0.2854 | 0.1481 | 0.6778 | 0.0058317 | 0.0067409 | 0.0210845 | 26 | 26 | 24 | 23 | 19 | 19 | 19 | 19 | 19 | 24 | 23 | 3 | 16 | 24 | 20 | 3 |
| Skirts | 52.13 | 20.8 | 26843.42 | 16061.8 | 2087 | 539 | 208 | 314 | 1026 | 27751.21 | 16709.53 | 0.5984 | 0.2784 | 0.304 | 0.1505 | 0.6556 | 0.0099739 | 0.0115198 | 0.0115162 | 13 | 19 | 22 | 20 | 23 | 23 | 23 | 23 | 23 | 22 | 20 | 4 | 24 | 2 | 11 | 25 |
| Accessories | 42.05 | 16.85 | 99096.96 | 59262.83 | 9813 | 2384 | 967 | 1497 | 4965 | 103385.5 | 62000.28 | 0.598 | 0.2886 | 0.2867 | 0.1526 | 0.6756 | 0.0368203 | 0.0425044 | 0.0541488 | 19 | 22 | 14 | 11 | 9 | 9 | 9 | 9 | 9 | 14 | 11 | 5 | 12 | 22 | 5 | 5 |
| Active | 50.94 | 21.35 | 117645.45 | 68332.26 | 8932 | 2180 | 938 | 1362 | 4452 | 113272.89 | 66015.46 | 0.5808 | 0.3008 | 0.288 | 0.1525 | 0.6713 | 0.0437121 | 0.0490092 | 0.0492873 | 15 | 18 | 11 | 7 | 11 | 11 | 10 | 10 | 11 | 10 | 9 | 6 | 4 | 21 | 7 | 11 |
| Maternity | 51.5 | 22.73 | 63613.6 | 35563.76 | 5086 | 1232 | 531 | 741 | 2582 | 61413.18 | 34274.78 | 0.5591 | 0.3012 | 0.2835 | 0.1457 | 0.677 | 0.0236362 | 0.025507 | 0.0280649 | 14 | 17 | 16 | 16 | 17 | 17 | 16 | 17 | 17 | 16 | 16 | 7 | 3 | 25 | 25 | 4 |
| Outerwear & Coats | 146.29 | 65.02 | 339222.29 | 188050.56 | 9028 | 2308 | 862 | 1318 | 4540 | 322743.18 | 179542.92 | 0.5544 | 0.2719 | 0.2994 | 0.146 | 0.663 | 0.1260408 | 0.1348735 | 0.0498171 | 1 | 2 | 1 | 1 | 10 | 10 | 11 | 11 | 10 | 1 | 1 | 8 | 26 | 4 | 23 | 19 |
| Dresses | 84.24 | 37.9 | 112895.24 | 62082.56 | 5358 | 1316 | 549 | 792 | 2701 | 113022.02 | 62283.44 | 0.5499 | 0.2944 | 0.2882 | 0.1478 | 0.6724 | 0.0419471 | 0.0445268 | 0.0295658 | 7 | 6 | 12 | 10 | 15 | 15 | 15 | 15 | 15 | 11 | 10 | 9 | 6 | 20 | 21 | 9 |
| Pants | 59.65 | 27.35 | 106719.7 | 57634.8 | 7239 | 1823 | 713 | 1076 | 3627 | 106167.82 | 57611.26 | 0.5401 | 0.2812 | 0.2958 | 0.1486 | 0.6655 | 0.0396526 | 0.0413368 | 0.0399453 | 9 | 12 | 13 | 12 | 13 | 13 | 13 | 13 | 13 | 13 | 12 | 10 | 21 | 10 | 15 | 16 |
| Underwear | 27.21 | 12.79 | 50614.6 | 26861.36 | 7505 | 1886 | 738 | 1122 | 3759 | 51345.06 | 27197.18 | 0.5307 | 0.2813 | 0.2955 | 0.1495 | 0.6659 | 0.0188063 | 0.0192655 | 0.0414131 | 23 | 24 | 17 | 17 | 12 | 12 | 12 | 12 | 12 | 17 | 17 | 11 | 20 | 11 | 13 | 14 |
| Sweaters | 75.46 | 36.32 | 213600.63 | 110714.83 | 11078 | 2792 | 1081 | 1688 | 5517 | 208115.59 | 107697.32 | 0.5183 | 0.2791 | 0.2973 | 0.1524 | 0.664 | 0.0793651 | 0.0794068 | 0.0611291 | 8 | 7 | 3 | 3 | 7 | 6 | 8 | 6 | 8 | 3 | 3 | 12 | 22 | 6 | 8 | 18 |
| Sleep & Lounge | 48.79 | 23.64 | 132101.2 | 68241.52 | 11071 | 2737 | 1128 | 1645 | 5561 | 134573.41 | 68950.32 | 0.5166 | 0.2918 | 0.2904 | 0.1486 | 0.6702 | 0.0490833 | 0.0489441 | 0.0610905 | 16 | 15 | 8 | 8 | 8 | 8 | 7 | 8 | 6 | 8 | 7 | 13 | 8 | 15 | 15 | 12 |
| Shorts | 47.29 | 23.69 | 136510.82 | 68155.43 | 11176 | 2819 | 1130 | 1690 | 5537 | 134644.7 | 67078.36 | 0.4993 | 0.2861 | 0.2972 | 0.1512 | 0.6626 | 0.0507217 | 0.0488824 | 0.0616699 | 17 | 14 | 7 | 9 | 6 | 5 | 6 | 5 | 7 | 7 | 8 | 14 | 15 | 7 | 10 | 21 |
| Plus | 39.47 | 19.84 | 44807.01 | 22316.68 | 4358 | 1070 | 436 | 646 | 2206 | 42048.64 | 21041.57 | 0.4981 | 0.2895 | 0.2883 | 0.1482 | 0.6734 | 0.0166484 | 0.016006 | 0.0240477 | 21 | 20 | 19 | 19 | 18 | 18 | 18 | 18 | 18 | 18 | 18 | 15 | 11 | 19 | 19 | 6 |
Top categories by Return Rate
WITH first_layer AS (
SELECT
  p.category AS product_category,
  ROUND(AVG(oi.sale_price), 2) AS avg_product_sale_price,
  ROUND(AVG(p.cost), 2) AS avg_product_cost,
ROUND(SUM(CASE WHEN oi.status = 'Complete' THEN oi.sale_price ELSE 0 END), 2) AS
revenue,
ROUND(SUM(CASE WHEN oi.status = 'Complete' THEN (oi.sale_price - p.cost) ELSE 0
END), 2) AS profit,
COUNT(*) AS unit_orders_placed,
SUM(CASE WHEN oi.status = 'Complete' THEN 1 ELSE 0 END) AS units_completed,
SUM(CASE WHEN oi.status = 'Returned' THEN 1 ELSE 0 END) AS units_returned,
SUM(CASE WHEN oi.status = 'Cancelled' THEN 1 ELSE 0 END) AS units_cancelled,
SUM(CASE WHEN oi.status IN ('Shipped', 'Processing') THEN 1 ELSE 0 END) AS units_en_route,
ROUND(SUM(CASE WHEN oi.status IN ('Returned', 'Cancelled') THEN oi.sale_price ELSE 0 END), 2) AS lost_revenue,
ROUND(SUM(CASE WHEN oi.status IN ('Returned', 'Cancelled') THEN (oi.sale_price - p.cost) ELSE 0 END), 2) AS lost_profit
FROM `bigquery-public-data.thelook_ecommerce.order_items` AS oi
JOIN `bigquery-public-data.thelook_ecommerce.orders` AS o
ON oi.order_id = o.order_id
JOIN `bigquery-public-data.thelook_ecommerce.products` AS p
ON oi.product_id = p.id
GROUP BY product_category
),
second_layer AS (
SELECT
  *,
  ROUND((profit / NULLIF(revenue, 0)), 4) AS profit_margin,
  ROUND(units_returned / NULLIF(units_completed + units_returned, 0), 4) AS return_rate,
  ROUND(units_completed / NULLIF(unit_orders_placed - units_cancelled, 0), 4) AS completion_rate,
  ROUND(units_cancelled / NULLIF(unit_orders_placed, 0), 4) AS cancellation_rate,
  ROUND(units_en_route / NULLIF(unit_orders_placed - (units_cancelled + units_returned), 0), 4) AS en_route_rate,
  ROUND(revenue / SUM(revenue) OVER(), 7) AS revenue_share,
  ROUND(profit / SUM(profit) OVER(), 7) AS profit_share,
  ROUND(unit_orders_placed / SUM(unit_orders_placed) OVER(), 7) AS unit_orders_placed_share
FROM first_layer
)
SELECT
  *,
  RANK() OVER(ORDER BY avg_product_sale_price DESC) AS avg_product_sale_price_rank,
  RANK() OVER(ORDER BY avg_product_cost DESC) AS avg_product_cost_rank,
  RANK() OVER(ORDER BY revenue DESC) AS revenue_rank,
  RANK() OVER(ORDER BY profit DESC) AS profit_rank,
  RANK() OVER(ORDER BY unit_orders_placed DESC) AS unit_orders_placed_rank,
  RANK() OVER(ORDER BY units_completed DESC) AS units_completed_rank,
  RANK() OVER(ORDER BY units_returned DESC) AS units_returned_rank,
  RANK() OVER(ORDER BY units_cancelled DESC) AS units_cancelled_rank,
  RANK() OVER(ORDER BY units_en_route DESC) AS units_en_route_rank,
  RANK() OVER(ORDER BY lost_revenue DESC) AS lost_revenue_rank,
  RANK() OVER(ORDER BY lost_profit DESC) AS lost_profit_rank,
  RANK() OVER(ORDER BY profit_margin DESC) AS profit_margin_rank,
  RANK() OVER(ORDER BY return_rate DESC) AS return_rate_rank,
  RANK() OVER(ORDER BY completion_rate DESC) AS completion_rate_rank,
  RANK() OVER(ORDER BY cancellation_rate DESC) AS cancellation_rate_rank,
  RANK() OVER(ORDER BY en_route_rate DESC) AS en_route_rate_rank
FROM second_layer
ORDER BY
  return_rate_rank ASC
LIMIT 15;| product_category | avg_product_sale_price | avg_product_cost | revenue | profit | unit_orders_placed | units_completed | units_returned | units_cancelled | units_en_route | lost_revenue | lost_profit | profit_margin | return_rate | completion_rate | cancellation_rate | en_route_rate | revenue_share | profit_share | unit_orders_placed_share | avg_product_sale_price_rank | avg_product_cost_rank | revenue_rank | profit_rank | unit_orders_placed_rank | units_completed_rank | units_returned_rank | units_cancelled_rank | units_en_route_rank | lost_revenue_rank | lost_profit_rank | profit_margin_rank | return_rate_rank | completion_rate_rank | cancellation_rate_rank | en_route_rate_rank |
|---|---|---|---|---|---|---|---|---|---|---|---|---|---|---|---|---|---|---|---|---|---|---|---|---|---|---|---|---|---|---|---|---|---|---|---|
| Blazers & Jackets | 90.68 | 34.35 | 65986.31 | 40954.92 | 3194 | 745 | 334 | 506 | 1609 | 76039.51 | 47305.1 | 0.6207 | 0.3095 | 0.2772 | 0.1584 | 0.6835 | 0.0245178 | 0.0293737 | 0.0176247 | 5 | 8 | 15 | 15 | 22 | 22 | 22 | 20 | 21 | 15 | 15 | 1 | 1 | 26 | 1 | 1 |
| Tops & Tees | 40.97 | 22.93 | 121151.89 | 53364.7 | 12000 | 2960 | 1292 | 1783 | 5965 | 123378.82 | 54313.77 | 0.4405 | 0.3039 | 0.2897 | 0.1486 | 0.6683 | 0.045015 | 0.0382742 | 0.0662168 | 20 | 16 | 9 | 14 | 3 | 3 | 3 | 3 | 3 | 9 | 13 | 22 | 2 | 16 | 15 | 13 |
| Maternity | 51.5 | 22.73 | 63613.6 | 35563.76 | 5086 | 1232 | 531 | 741 | 2582 | 61413.18 | 34274.78 | 0.5591 | 0.3012 | 0.2835 | 0.1457 | 0.677 | 0.0236362 | 0.025507 | 0.0280649 | 14 | 17 | 16 | 16 | 17 | 17 | 16 | 17 | 17 | 16 | 16 | 7 | 3 | 25 | 25 | 4 |
| Active | 50.94 | 21.35 | 117645.45 | 68332.26 | 8932 | 2180 | 938 | 1362 | 4452 | 113272.89 | 66015.46 | 0.5808 | 0.3008 | 0.288 | 0.1525 | 0.6713 | 0.0437121 | 0.0490092 | 0.0492873 | 15 | 18 | 11 | 7 | 11 | 11 | 10 | 10 | 11 | 10 | 9 | 6 | 4 | 21 | 7 | 11 |
| Leggings | 26.79 | 16.07 | 22032.86 | 8796.32 | 3246 | 804 | 345 | 500 | 1597 | 22344.1 | 8926.78 | 0.3992 | 0.3003 | 0.2928 | 0.154 | 0.6651 | 0.0081865 | 0.0063089 | 0.0179116 | 24 | 23 | 23 | 24 | 21 | 21 | 21 | 21 | 22 | 23 | 24 | 23 | 5 | 13 | 4 | 17 |
| Dresses | 84.24 | 37.9 | 112895.24 | 62082.56 | 5358 | 1316 | 549 | 792 | 2701 | 113022.02 | 62283.44 | 0.5499 | 0.2944 | 0.2882 | 0.1478 | 0.6724 | 0.0419471 | 0.0445268 | 0.0295658 | 7 | 6 | 12 | 10 | 15 | 15 | 15 | 15 | 15 | 11 | 10 | 9 | 6 | 20 | 21 | 9 |
| Swim | 57.2 | 28.98 | 156523.7 | 76716.71 | 11246 | 2772 | 1143 | 1660 | 5671 | 159217.24 | 78510.83 | 0.4901 | 0.292 | 0.2892 | 0.1476 | 0.6717 | 0.0581577 | 0.0550227 | 0.0620561 | 10 | 10 | 4 | 5 | 5 | 7 | 5 | 7 | 5 | 6 | 5 | 16 | 7 | 17 | 22 | 10 |
| Sleep & Lounge | 48.79 | 23.64 | 132101.2 | 68241.52 | 11071 | 2737 | 1128 | 1645 | 5561 | 134573.41 | 68950.32 | 0.5166 | 0.2918 | 0.2904 | 0.1486 | 0.6702 | 0.0490833 | 0.0489441 | 0.0610905 | 16 | 15 | 8 | 8 | 8 | 8 | 7 | 8 | 6 | 8 | 7 | 13 | 8 | 15 | 15 | 12 |
| Jeans | 97.76 | 52.34 | 308764.08 | 143520.48 | 12655 | 3169 | 1303 | 1955 | 6228 | 319052.52 | 148299.49 | 0.4648 | 0.2914 | 0.2962 | 0.1545 | 0.6628 | 0.1147238 | 0.1029357 | 0.0698311 | 4 | 4 | 2 | 2 | 2 | 2 | 2 | 2 | 2 | 2 | 2 | 21 | 9 | 9 | 3 | 20 |
| Socks | 21.13 | 12.76 | 31572.07 | 12517.44 | 6329 | 1557 | 636 | 939 | 3197 | 32927.59 | 13032.11 | 0.3965 | 0.29 | 0.2889 | 0.1484 | 0.6725 | 0.0117309 | 0.0089777 | 0.0349238 | 25 | 25 | 21 | 22 | 14 | 14 | 14 | 14 | 14 | 20 | 21 | 24 | 10 | 18 | 18 | 8 |
| Plus | 39.47 | 19.84 | 44807.01 | 22316.68 | 4358 | 1070 | 436 | 646 | 2206 | 42048.64 | 21041.57 | 0.4981 | 0.2895 | 0.2883 | 0.1482 | 0.6734 | 0.0166484 | 0.016006 | 0.0240477 | 21 | 20 | 19 | 19 | 18 | 18 | 18 | 18 | 18 | 18 | 18 | 15 | 11 | 19 | 19 | 6 |
| Accessories | 42.05 | 16.85 | 99096.96 | 59262.83 | 9813 | 2384 | 967 | 1497 | 4965 | 103385.5 | 62000.28 | 0.598 | 0.2886 | 0.2867 | 0.1526 | 0.6756 | 0.0368203 | 0.0425044 | 0.0541488 | 19 | 22 | 14 | 11 | 9 | 9 | 9 | 9 | 9 | 14 | 11 | 5 | 12 | 22 | 5 | 5 |
| Pants & Capris | 55.37 | 29.2 | 49331.52 | 23421.93 | 3392 | 864 | 350 | 481 | 1697 | 41999.86 | 19777.56 | 0.4748 | 0.2883 | 0.2968 | 0.1418 | 0.6626 | 0.0183295 | 0.0167987 | 0.0187173 | 11 | 9 | 18 | 18 | 20 | 20 | 20 | 22 | 20 | 19 | 19 | 18 | 13 | 8 | 26 | 21 |
| Fashion Hoodies & Sweatshirts | 54.02 | 28.09 | 155933.0 | 74918.07 | 11737 | 2951 | 1191 | 1714 | 5881 | 159794.53 | 76980.63 | 0.4805 | 0.2875 | 0.2944 | 0.146 | 0.6659 | 0.0579382 | 0.0537327 | 0.0647655 | 12 | 11 | 5 | 6 | 4 | 4 | 4 | 4 | 4 | 5 | 6 | 17 | 14 | 12 | 23 | 14 |
| Shorts | 47.29 | 23.69 | 136510.82 | 68155.43 | 11176 | 2819 | 1130 | 1690 | 5537 | 134644.7 | 67078.36 | 0.4993 | 0.2861 | 0.2972 | 0.1512 | 0.6626 | 0.0507217 | 0.0488824 | 0.0616699 | 17 | 14 | 7 | 9 | 6 | 5 | 6 | 5 | 7 | 7 | 8 | 14 | 15 | 7 | 10 | 21 |
Analytical Insights & Business Recommendations
Outerwear & Coats is the clear category leader with $339,222.29 in revenue and $188,050.56 in profit – both #1 overall. However, it achieves this with only 9,028 unit orders (rank #10), meaning it generates far more revenue per unit than any other category thanks to its $146.29 average sale price, the highest across all 26 categories. With a 55.4% profit margin, Outerwear & Coats also ranks above the median for margin efficiency. Its return rate of 27.2% is actually the lowest among all categories, suggesting that customers purchasing outerwear are more deliberate and satisfied with their purchases. Outerwear is the profit engine of the business. Increase internal inventory allocation, marketing spend, and priority fulfillment resources for this category. Ensure stockouts are prevented – each lost outerwear sale costs an average of $146.29 in revenue and $81.30 in profit, far exceeding the cost of overstocking. Additionally, this category's demand likely peaks seasonally before and during winter months, so inventory orders should be front-loaded accordingly.
Intimates leads all categories in unit orders (13,423) but ranks #10 in revenue ($118,381.20) due to its low average sale price of $33.75. Conversely, Suits & Sport Coats ranks #16 in unit orders (5,176) but #4 in profit ($92,034.55) thanks to its $124.74 average sale price and 59.9% profit margin. This pattern – high-volume/low-revenue vs. low-volume/high-revenue – is consistent across the category landscape. Tops & Tees, Intimates, and Fashion Hoodies move the most units but contribute less to profit per order. For high-volume, low-revenue categories (Intimates, Tops & Tees, Shorts), operational efficiency is paramount. Streamline fulfillment for these items – batch picking, simplified packaging, automated label generation – since the margin per unit is thin and any fulfillment inefficiency eats into profit. For low-volume, high-revenue categories (Suits & Sport Coats, Outerwear), invest in premium fulfillment and quality packaging to protect the customer experience on high-value purchases.
Blazers & Jackets commands the highest profit margin (62.1%) across all categories, despite ranking only #15 in revenue and #22 in unit orders. This means every dollar of blazer revenue retains $0.62 in profit – nearly 50% more efficient than bottom-margin categories like Socks (39.7%) or Clothing Sets (38.5%). Accessories (59.8% margin), Socks & Hosiery (59.9%), and Suits & Sport Coats (59.9%) form a tier of high-margin categories. Notably, Socks & Hosiery achieves a top-3 margin despite the lowest average sale price ($16.81) – meaning the cost-to-price ratio is extremely favorable even at low price points. Strategically promote high-margin categories through targeted advertising. A $1 increase in Blazers & Jackets demand yields $0.62 in profit vs. $0.44 for Tops & Tees. Cross-sell blazers and accessories when customers are browsing jeans or outerwear. For Socks & Hosiery, the near-60% margin on a $16 product suggests significant untapped potential if volume can be increased – consider featuring them as add-on recommendations at checkout.
Category return rates are remarkably tight, ranging from 27.2% (Outerwear & Coats) to 31.0% (Blazers & Jackets). The ~4 percentage point spread across all 26 categories suggests that returns are driven more by systemic business factors (e.g., return policy leniency, shipping delays, overall site UX) than by category-specific product quality. Blazers & Jackets has both the highest margin (62.1%) and the highest return rate (31.0%), which may seem contradictory but reflects the category's nature – fit-dependent items where customers may order multiple sizes. Since return rates are uniformly high across all categories (all above 27%), invest in platform-wide return reduction strategies rather than category-specific ones: improved sizing tools, better product photography, clearer product descriptions, and potentially a try-before-you-buy or virtual fitting room feature. A 2-point reduction in the business-wide return rate would compound into significant recovered revenue across all categories.
Bottom Categories
Bottom categories by Revenue
WITH first_layer AS (
SELECT
  p.category AS product_category,
  ROUND(AVG(oi.sale_price), 2) AS avg_product_sale_price,
  ROUND(AVG(p.cost), 2) AS avg_product_cost,
ROUND(SUM(CASE WHEN oi.status = 'Complete' THEN oi.sale_price ELSE 0 END), 2) AS
revenue,
ROUND(SUM(CASE WHEN oi.status = 'Complete' THEN (oi.sale_price - p.cost) ELSE 0
END), 2) AS profit,
COUNT(*) AS unit_orders_placed,
SUM(CASE WHEN oi.status = 'Complete' THEN 1 ELSE 0 END) AS units_completed,
SUM(CASE WHEN oi.status = 'Returned' THEN 1 ELSE 0 END) AS units_returned,
SUM(CASE WHEN oi.status = 'Cancelled' THEN 1 ELSE 0 END) AS units_cancelled,
SUM(CASE WHEN oi.status IN ('Shipped', 'Processing') THEN 1 ELSE 0 END) AS units_en_route,
ROUND(SUM(CASE WHEN oi.status IN ('Returned', 'Cancelled') THEN oi.sale_price ELSE 0 END), 2) AS lost_revenue,
ROUND(SUM(CASE WHEN oi.status IN ('Returned', 'Cancelled') THEN (oi.sale_price - p.cost) ELSE 0 END), 2) AS lost_profit
FROM `bigquery-public-data.thelook_ecommerce.order_items` AS oi
JOIN `bigquery-public-data.thelook_ecommerce.orders` AS o
ON oi.order_id = o.order_id
JOIN `bigquery-public-data.thelook_ecommerce.products` AS p
ON oi.product_id = p.id
GROUP BY product_category
),
second_layer AS (
SELECT
  *,
  ROUND((profit / NULLIF(revenue, 0)), 4) AS profit_margin,
  ROUND(units_returned / NULLIF(units_completed + units_returned, 0), 4) AS return_rate,
  ROUND(units_completed / NULLIF(unit_orders_placed - units_cancelled, 0), 4) AS completion_rate,
  ROUND(units_cancelled / NULLIF(unit_orders_placed, 0), 4) AS cancellation_rate,
  ROUND(units_en_route / NULLIF(unit_orders_placed - (units_cancelled + units_returned), 0), 4) AS en_route_rate,
  ROUND(revenue / SUM(revenue) OVER(), 7) AS revenue_share,
  ROUND(profit / SUM(profit) OVER(), 7) AS profit_share,
  ROUND(unit_orders_placed / SUM(unit_orders_placed) OVER(), 7) AS unit_orders_placed_share
FROM first_layer
)
SELECT
  *,
  RANK() OVER(ORDER BY avg_product_sale_price DESC) AS avg_product_sale_price_rank,
  RANK() OVER(ORDER BY avg_product_cost DESC) AS avg_product_cost_rank,
  RANK() OVER(ORDER BY revenue DESC) AS revenue_rank,
  RANK() OVER(ORDER BY profit DESC) AS profit_rank,
  RANK() OVER(ORDER BY unit_orders_placed DESC) AS unit_orders_placed_rank,
  RANK() OVER(ORDER BY units_completed DESC) AS units_completed_rank,
  RANK() OVER(ORDER BY units_returned DESC) AS units_returned_rank,
  RANK() OVER(ORDER BY units_cancelled DESC) AS units_cancelled_rank,
  RANK() OVER(ORDER BY units_en_route DESC) AS units_en_route_rank,
  RANK() OVER(ORDER BY lost_revenue DESC) AS lost_revenue_rank,
  RANK() OVER(ORDER BY lost_profit DESC) AS lost_profit_rank,
  RANK() OVER(ORDER BY profit_margin DESC) AS profit_margin_rank,
  RANK() OVER(ORDER BY return_rate DESC) AS return_rate_rank,
  RANK() OVER(ORDER BY completion_rate DESC) AS completion_rate_rank,
  RANK() OVER(ORDER BY cancellation_rate DESC) AS cancellation_rate_rank,
  RANK() OVER(ORDER BY en_route_rate DESC) AS en_route_rate_rank
FROM second_layer
ORDER BY
  revenue_rank DESC
LIMIT 15;| product_category | avg_product_sale_price | avg_product_cost | revenue | profit | unit_orders_placed | units_completed | units_returned | units_cancelled | units_en_route | lost_revenue | lost_profit | profit_margin | return_rate | completion_rate | cancellation_rate | en_route_rate | revenue_share | profit_share | unit_orders_placed_share | avg_product_sale_price_rank | avg_product_cost_rank | revenue_rank | profit_rank | unit_orders_placed_rank | units_completed_rank | units_returned_rank | units_cancelled_rank | units_en_route_rank | lost_revenue_rank | lost_profit_rank | profit_margin_rank | return_rate_rank | completion_rate_rank | cancellation_rate_rank | en_route_rate_rank |
|---|---|---|---|---|---|---|---|---|---|---|---|---|---|---|---|---|---|---|---|---|---|---|---|---|---|---|---|---|---|---|---|---|---|---|---|
| Clothing Sets | 85.82 | 52.9 | 5539.46 | 2131.98 | 221 | 60 | 24 | 35 | 102 | 4604.36 | 1726.01 | 0.3849 | 0.2857 | 0.3226 | 0.1584 | 0.6296 | 0.0020582 | 0.0015291 | 0.0012195 | 6 | 3 | 26 | 26 | 26 | 26 | 26 | 26 | 26 | 26 | 26 | 26 | 17 | 1 | 1 | 26 |
| Jumpsuits & Rompers | 46.79 | 24.83 | 10339.76 | 4897.93 | 929 | 230 | 86 | 139 | 474 | 9496.98 | 4463.25 | 0.4737 | 0.2722 | 0.2911 | 0.1496 | 0.6733 | 0.0038418 | 0.0035129 | 0.0051263 | 18 | 13 | 25 | 25 | 25 | 25 | 25 | 25 | 25 | 25 | 25 | 19 | 25 | 14 | 12 | 7 |
| Socks & Hosiery | 16.81 | 6.75 | 15695.27 | 9398.63 | 3821 | 929 | 372 | 566 | 1954 | 15784.16 | 9453.9 | 0.5988 | 0.2859 | 0.2854 | 0.1481 | 0.6778 | 0.0058317 | 0.0067409 | 0.0210845 | 26 | 26 | 24 | 23 | 19 | 19 | 19 | 19 | 19 | 24 | 23 | 3 | 16 | 24 | 20 | 3 |
| Leggings | 26.79 | 16.07 | 22032.86 | 8796.32 | 3246 | 804 | 345 | 500 | 1597 | 22344.1 | 8926.78 | 0.3992 | 0.3003 | 0.2928 | 0.154 | 0.6651 | 0.0081865 | 0.0063089 | 0.0179116 | 24 | 23 | 23 | 24 | 21 | 21 | 21 | 21 | 22 | 23 | 24 | 23 | 5 | 13 | 4 | 17 |
| Skirts | 52.13 | 20.8 | 26843.42 | 16061.8 | 2087 | 539 | 208 | 314 | 1026 | 27751.21 | 16709.53 | 0.5984 | 0.2784 | 0.304 | 0.1505 | 0.6556 | 0.0099739 | 0.0115198 | 0.0115162 | 13 | 19 | 22 | 20 | 23 | 23 | 23 | 23 | 23 | 22 | 20 | 4 | 24 | 2 | 11 | 25 |
| Socks | 21.13 | 12.76 | 31572.07 | 12517.44 | 6329 | 1557 | 636 | 939 | 3197 | 32927.59 | 13032.11 | 0.3965 | 0.29 | 0.2889 | 0.1484 | 0.6725 | 0.0117309 | 0.0089777 | 0.0349238 | 25 | 25 | 21 | 22 | 14 | 14 | 14 | 14 | 14 | 20 | 21 | 24 | 10 | 18 | 18 | 8 |
| Suits | 117.3 | 70.96 | 32903.24 | 13000.36 | 1123 | 287 | 113 | 167 | 556 | 32368.47 | 12778.14 | 0.3951 | 0.2825 | 0.3002 | 0.1487 | 0.6595 | 0.0122255 | 0.0093241 | 0.0061968 | 3 | 1 | 20 | 21 | 24 | 24 | 24 | 24 | 24 | 21 | 22 | 25 | 18 | 3 | 14 | 24 |
| Plus | 39.47 | 19.84 | 44807.01 | 22316.68 | 4358 | 1070 | 436 | 646 | 2206 | 42048.64 | 21041.57 | 0.4981 | 0.2895 | 0.2883 | 0.1482 | 0.6734 | 0.0166484 | 0.016006 | 0.0240477 | 21 | 20 | 19 | 19 | 18 | 18 | 18 | 18 | 18 | 18 | 18 | 15 | 11 | 19 | 19 | 6 |
| Pants & Capris | 55.37 | 29.2 | 49331.52 | 23421.93 | 3392 | 864 | 350 | 481 | 1697 | 41999.86 | 19777.56 | 0.4748 | 0.2883 | 0.2968 | 0.1418 | 0.6626 | 0.0183295 | 0.0167987 | 0.0187173 | 11 | 9 | 18 | 18 | 20 | 20 | 20 | 22 | 20 | 19 | 19 | 18 | 13 | 8 | 26 | 21 |
| Underwear | 27.21 | 12.79 | 50614.6 | 26861.36 | 7505 | 1886 | 738 | 1122 | 3759 | 51345.06 | 27197.18 | 0.5307 | 0.2813 | 0.2955 | 0.1495 | 0.6659 | 0.0188063 | 0.0192655 | 0.0414131 | 23 | 24 | 17 | 17 | 12 | 12 | 12 | 12 | 12 | 17 | 17 | 11 | 20 | 11 | 13 | 14 |
| Maternity | 51.5 | 22.73 | 63613.6 | 35563.76 | 5086 | 1232 | 531 | 741 | 2582 | 61413.18 | 34274.78 | 0.5591 | 0.3012 | 0.2835 | 0.1457 | 0.677 | 0.0236362 | 0.025507 | 0.0280649 | 14 | 17 | 16 | 16 | 17 | 17 | 16 | 17 | 17 | 16 | 16 | 7 | 3 | 25 | 25 | 4 |
| Blazers & Jackets | 90.68 | 34.35 | 65986.31 | 40954.92 | 3194 | 745 | 334 | 506 | 1609 | 76039.51 | 47305.1 | 0.6207 | 0.3095 | 0.2772 | 0.1584 | 0.6835 | 0.0245178 | 0.0293737 | 0.0176247 | 5 | 8 | 15 | 15 | 22 | 22 | 22 | 20 | 21 | 15 | 15 | 1 | 1 | 26 | 1 | 1 |
| Accessories | 42.05 | 16.85 | 99096.96 | 59262.83 | 9813 | 2384 | 967 | 1497 | 4965 | 103385.5 | 62000.28 | 0.598 | 0.2886 | 0.2867 | 0.1526 | 0.6756 | 0.0368203 | 0.0425044 | 0.0541488 | 19 | 22 | 14 | 11 | 9 | 9 | 9 | 9 | 9 | 14 | 11 | 5 | 12 | 22 | 5 | 5 |
| Pants | 59.65 | 27.35 | 106719.7 | 57634.8 | 7239 | 1823 | 713 | 1076 | 3627 | 106167.82 | 57611.26 | 0.5401 | 0.2812 | 0.2958 | 0.1486 | 0.6655 | 0.0396526 | 0.0413368 | 0.0399453 | 9 | 12 | 13 | 12 | 13 | 13 | 13 | 13 | 13 | 13 | 12 | 10 | 21 | 10 | 15 | 16 |
| Dresses | 84.24 | 37.9 | 112895.24 | 62082.56 | 5358 | 1316 | 549 | 792 | 2701 | 113022.02 | 62283.44 | 0.5499 | 0.2944 | 0.2882 | 0.1478 | 0.6724 | 0.0419471 | 0.0445268 | 0.0295658 | 7 | 6 | 12 | 10 | 15 | 15 | 15 | 15 | 15 | 11 | 10 | 9 | 6 | 20 | 21 | 9 |
Analytical Insights & Business Recommendations
Clothing Sets is the worst-performing category across nearly every metric: #26 in revenue ($5,539.46), #26 in profit ($2,131.98), #26 in unit orders (221), and notably has the highest cancellation rate (15.8%) and highest completion rate (32.3% – meaning orders that survive cancellation tend to complete). The combination of an $85.82 average sale price with a $52.90 cost leaves a margin of only 38.5%, the lowest of all 26 categories.
Clothing Sets should be considered for discontinuation or dramatic restructuring. With the lowest profit margin, fewest orders, and highest cancellation rate in the business, this category consumes disproportionate operational resources relative to its contribution. If the category is retained, its product cost structure ($52.90 avg cost on an $85.82 price) needs renegotiation – the cost-to-price ratio is over 61%, far above the business average.
Suits rank #24 in unit orders (1,123) and #21 in profit ($13,000.36) despite having the highest average product cost ($70.96) and third-highest average sale price ($117.30). The resulting profit margin of 39.5% is second-lowest, meaning the premium pricing doesn't translate to premium profitability. This is a category where high input costs (likely driven by fabric quality and construction complexity) compress margins despite strong retail pricing. The 28.3% return rate is moderate, so the margin issue is cost-driven rather than return-driven.
Investigate supplier cost structures for the Suits category. At $70.96 average cost, Suits products consume nearly 60.5% of revenue in input costs – compared to 44.5% for Outerwear & Coats, which has an even higher average sale price. Consider whether a shift to suppliers offering better cost-to-quality ratios could preserve the product's market positioning while improving margins toward the 50%+ range.
Socks (6,329 orders, 39.7% margin) and Leggings (3,246 orders, 39.9% margin) represent high-volume categories that contribute minimally to profit due to structurally low margins. Socks generate $31,572.07 in revenue but only $12,517.44 in profit, while Leggings generate $22,032.86 revenue with $8,796.32 profit. Both categories have average costs that consume ~60% of sale price ($12.76/$21.13 for Socks; $16.07/$26.79 for Leggings), leaving thin absolute profit per unit.
Rather than dropping these categories (they drive significant order volume which may increase basket size through cross-selling), optimize their fulfillment costs. Socks and leggings are lightweight, compact items ideal for low-cost shipping. Consider offering multi-pack deals – a 3-pack of socks at a slight per-unit discount still generates more total profit than a single pair while reducing per-order shipping costs.
The smallest categories by order volume – Clothing Sets (221), Jumpsuits & Rompers (929), Suits (1,123) – generate relatively few transactions while requiring full catalog management, supplier relationships, and inventory allocation. Evaluate whether the smallest categories justify their operational overhead. Clothing Sets' 221 orders represent just 0.12% of total order volume. If maintaining supplier relationships, inventory space, and marketing for this category costs more than the $2,131.98 in profit it generates, the category should be wound down or consolidated into a broader category (e.g., merged into Active or Outerwear depending on product types).
Long Term Trends
Long Term Trend: Total Revenue and Profit
SELECT
	DATE_TRUNC(DATE(o.created_at), MONTH) AS month,
	SUM(oi.sale_price) AS revenue,
	SUM(oi.sale_price - p.cost) AS profit
FROM `bigquery-public-data.thelook_ecommerce.order_items` AS oi
JOIN `bigquery-public-data.thelook_ecommerce.orders` AS o
ON oi.order_id = o.order_id
JOIN `bigquery-public-data.thelook_ecommerce.products` AS p
ON oi.product_id = p.id
WHERE oi.status = 'Complete'
GROUP BY month
ORDER BY month;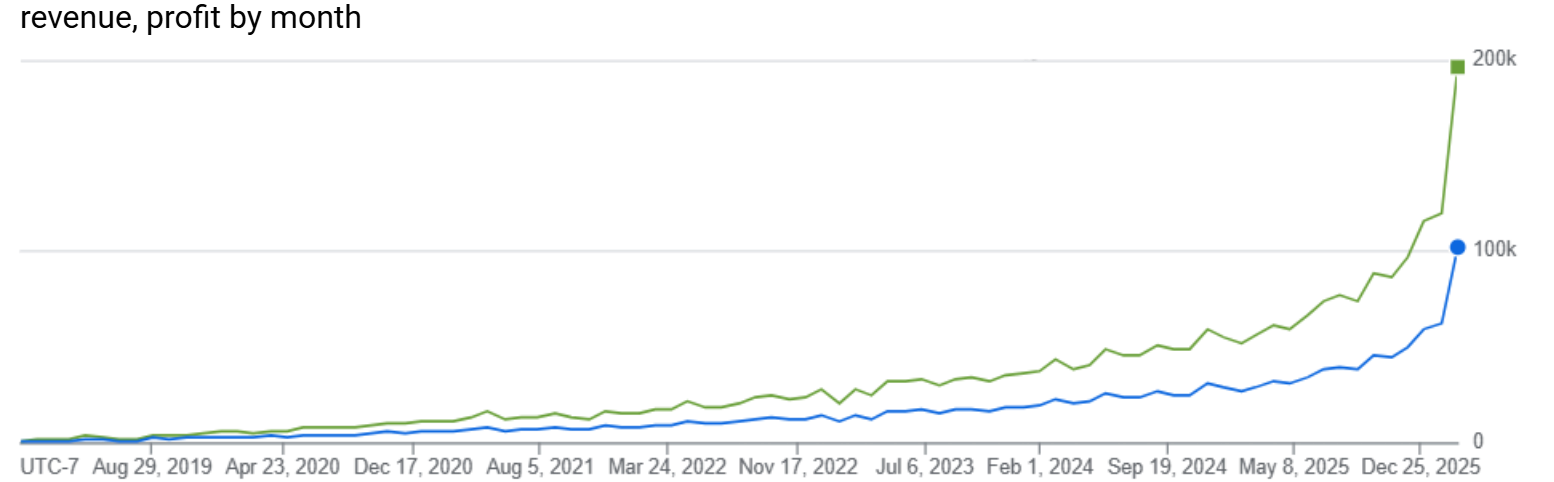
Long Term Trend: Units Sold
SELECT
	DATE_TRUNC(DATE(o.created_at), MONTH) AS month,
	COUNT(*) AS units_sold
FROM `bigquery-public-data.thelook_ecommerce.order_items` AS oi
JOIN `bigquery-public-data.thelook_ecommerce.orders` AS o
ON oi.order_id = o.order_id
WHERE oi.status = 'Complete'
GROUP BY month
ORDER BY month;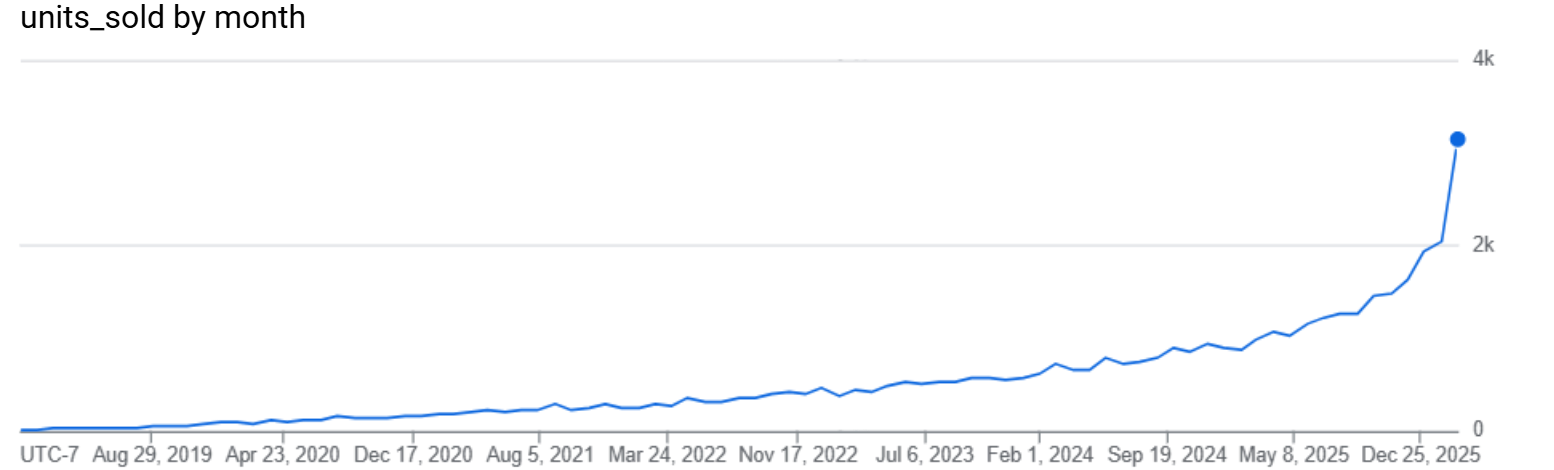
Long Term Trend: Profit Margin
WITH metrics AS (
	SELECT
		DATE_TRUNC(DATE(o.created_at), MONTH) AS month,
		SUM(oi.sale_price - p.cost) AS profit,
		SUM(oi.sale_price) AS revenue
	FROM `bigquery-public-data.thelook_ecommerce.order_items` AS oi
JOIN `bigquery-public-data.thelook_ecommerce.orders` AS o
ON oi.order_id = o.order_id
JOIN `bigquery-public-data.thelook_ecommerce.products` AS p
ON oi.product_id = p.id
WHERE oi.status = 'Complete'
GROUP BY month
)
SELECT
	month,
	ROUND(profit/NULLIF(revenue, 0), 4) AS profit_margin
FROM
	metrics
ORDER BY
	month;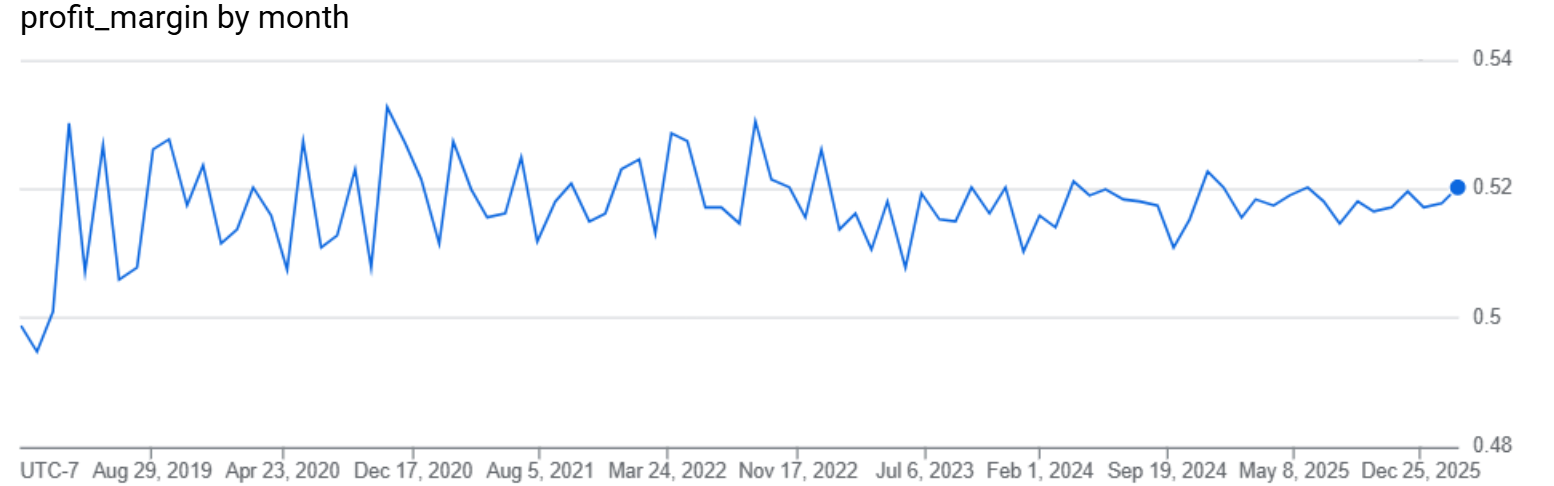
Long Term Trend: Return Rate
WITH metrics AS (
SELECT
	DATE_TRUNC(DATE(o.created_at), MONTH) AS month,
	SUM(CASE WHEN oi.status = 'Complete' THEN 1 ELSE 0 END) AS complete_item_count,
	SUM(CASE WHEN oi.status = 'Returned' THEN 1 ELSE 0 END) AS returned_item_count
FROM `bigquery-public-data.thelook_ecommerce.order_items` AS oi
JOIN `bigquery-public-data.thelook_ecommerce.orders` AS o
ON oi.order_id = o.order_id
GROUP BY month
)
SELECT
	month,
	ROUND(returned_item_count / NULLIF((complete_item_count + returned_item_count),
0), 4) AS return_rate
FROM metrics
ORDER BY month;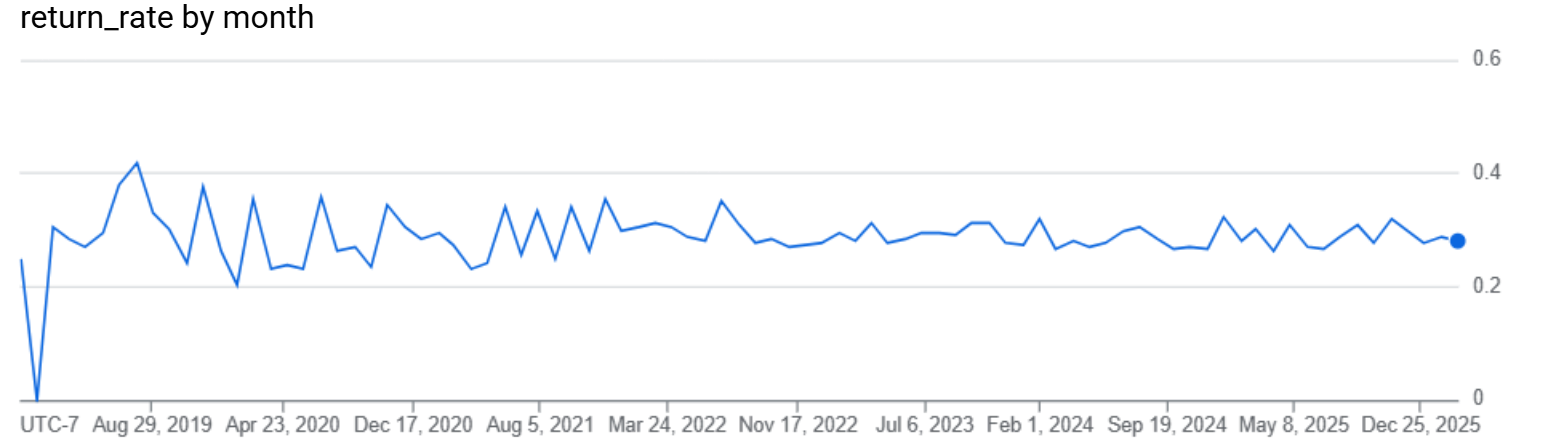
Analytical Insights & Business Recommendations
The long-term trend queries aggregate monthly revenue and profit from completed orders across the full date range of the dataset. For a growing e-commerce business, we expect to see an upward trajectory in both metrics, with revenue growth outpacing or tracking profit growth depending on margin stability. It is important to track whether profit growth is keeping pace with revenue growth. If revenue is growing faster than profit over time, it indicates either margin compression (rising product costs, increased discounting) or a shift in product mix toward lower-margin categories. Use demand forecasting and predictive modeling on the historical sales data to anticipate future revenue trends, plan inventory orders, and set staffing levels for peak periods.
Monthly units sold provides the clearest signal of demand growth independent of pricing changes. While revenue can increase due to price hikes, units sold directly reflects whether more customers are buying more products. Overlaying the units sold trend with marketing spend or promotional calendar data (if available) can measure campaign effectiveness. If units spike in specific months, identifying what drove those surges – new product launches, seasonal campaigns, or organic growth – and replicating successful patterns is key. Units sold is also the foundation for inventory planning: use the monthly trend to establish baseline demand, then adjust for seasonal patterns identified in the Seasonal Trends section.
Monthly profit margin trend reveals whether the business is becoming more or less efficient at converting revenue to profit over time. A stable or rising margin indicates good cost management and pricing discipline, while a declining margin signals potential issues: rising supplier costs, increased discounting, or a shift toward lower-margin products. If the profit margin trend shows compression over time, investigate root causes at the category and brand level. Cross-reference the margin trend with the category and brand analyses from earlier sections to identify whether specific segments are dragging overall margins down. Proactive supplier cost negotiations (particularly with high-volume brands like Diesel, Calvin Klein, and Carhartt identified in the brand analysis) should be timed to coincide with contract renewal periods.
Tracking return rate over time reveals whether the business is improving or deteriorating in customer satisfaction and product quality. A stable return rate (~28–30% as seen in the category analysis) suggests systemic factors. A rising trend would indicate worsening product quality or increasingly misaligned customer expectations, while a declining trend would validate that quality or UX improvements are working. The return rate trend is a lagging indicator – it reflects problems that already occurred. Complement it with leading indicators like product page bounce rates, customer review sentiment, and repeat purchase rates. If the return rate trend is flat (consistent with the uniformly ~28% rates seen across categories), it reinforces that a platform-wide intervention (better sizing tools, enhanced product photography, improved checkout UX) would be more effective than targeted product-level fixes.
The combination of these four long-term metrics – revenue, units sold, margin, and return rate – creates a business health dashboard. Revenue growth with stable margins indicates healthy scaling, while revenue growth with declining margins suggests unsustainable growth. Increasing units with declining revenue per unit suggests a product mix shift toward lower-price items. Establishing a monthly business review cadence using these four trend metrics is recommended. Set threshold alerts: if profit margin drops below 50% in any month, trigger a cost review; if return rate exceeds 30% in any month, trigger a quality review; if units sold declines month-over-month for two consecutive months, trigger a demand analysis. These trends enable proactive management rather than reactive problem-solving.
Seasonal Trends
Seasonal Trend: Revenue and Profit
SELECT
	EXTRACT(MONTH FROM o.created_at) AS month,
	SUM(oi.sale_price) AS revenue,
	SUM(oi.sale_price - p.cost) AS profit
FROM `bigquery-public-data.thelook_ecommerce.order_items` AS oi
JOIN `bigquery-public-data.thelook_ecommerce.orders` AS o
ON oi.order_id = o.order_id
JOIN `bigquery-public-data.thelook_ecommerce.products` AS p
ON oi.product_id = p.id
WHERE oi.status = 'Complete'
GROUP BY month
ORDER BY month;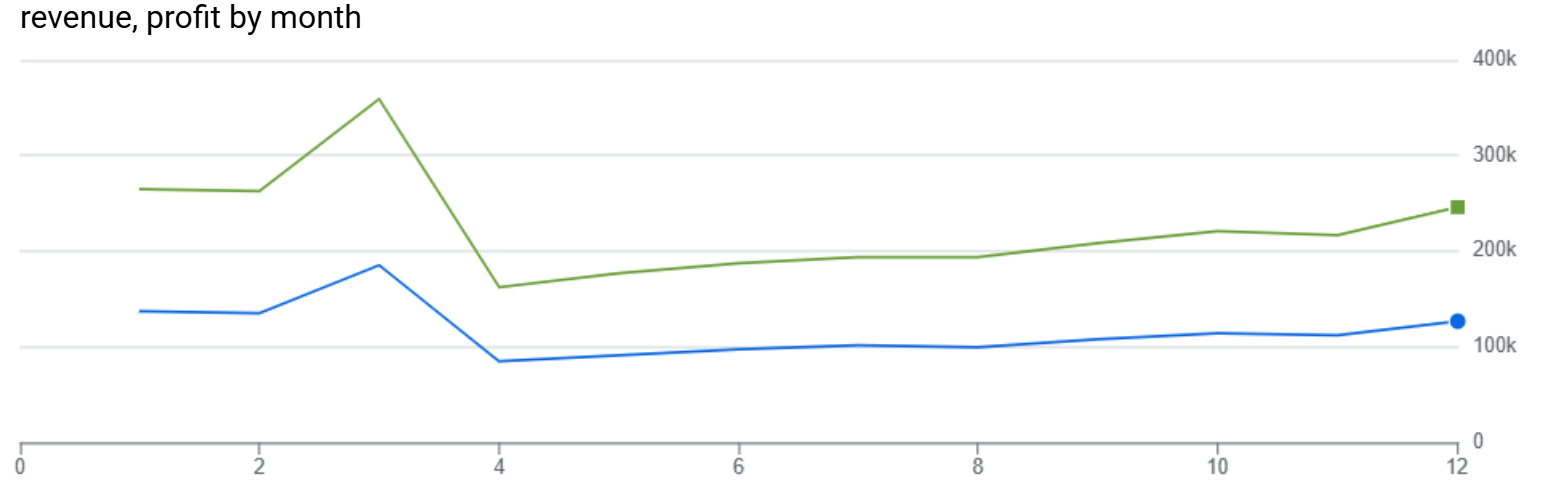
Seasonal Trend: Units Sold
SELECT
	EXTRACT(MONTH FROM o.created_at) AS month,
	COUNT(*) AS units_sold
FROM `bigquery-public-data.thelook_ecommerce.order_items` AS oi
JOIN `bigquery-public-data.thelook_ecommerce.orders` AS o
ON oi.order_id = o.order_id
WHERE oi.status = 'Complete'
GROUP BY month
ORDER BY month;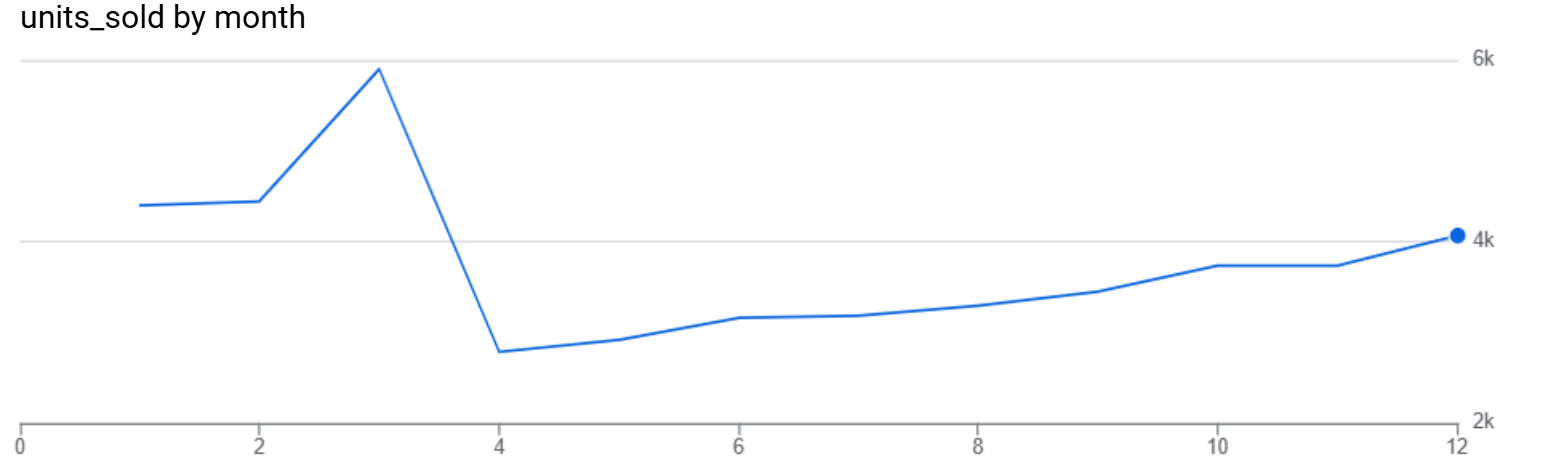
Seasonal Trend: Profit Margin
WITH metrics AS (
	SELECT
		EXTRACT(MONTH FROM o.created_at) AS month,
		SUM(oi.sale_price - p.cost) AS profit,
		SUM(oi.sale_price) AS revenue
	FROM `bigquery-public-data.thelook_ecommerce.order_items` AS oi
JOIN `bigquery-public-data.thelook_ecommerce.orders` AS o
ON oi.order_id = o.order_id
JOIN `bigquery-public-data.thelook_ecommerce.products` AS p
ON oi.product_id = p.id
WHERE oi.status = 'Complete'
GROUP BY month
)
SELECT
	month,
	ROUND(profit/NULLIF(revenue, 0), 4) AS profit_margin
FROM metrics
ORDER BY month;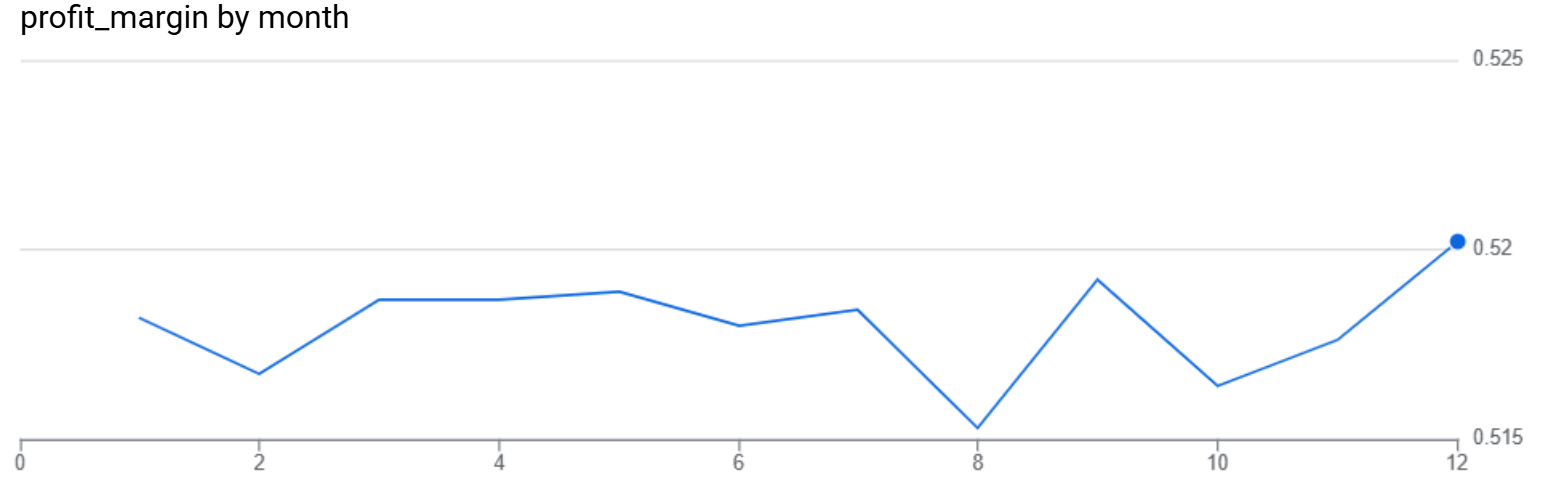
Seasonal Trend: Return Rate
WITH metrics AS (
SELECT
	EXTRACT(MONTH FROM o.created_at) AS month,
	SUM(CASE WHEN oi.status = 'Complete' THEN 1 ELSE 0 END) AS complete_item_count,
	SUM(CASE WHEN oi.status = 'Returned' THEN 1 ELSE 0 END) AS returned_item_count
FROM `bigquery-public-data.thelook_ecommerce.order_items` AS oi
JOIN `bigquery-public-data.thelook_ecommerce.orders` AS o
ON oi.order_id = o.order_id
GROUP BY month
)
SELECT
	month,
	ROUND(returned_item_count / NULLIF((complete_item_count + returned_item_count),
0), 4) AS return_rate
FROM metrics
ORDER BY month;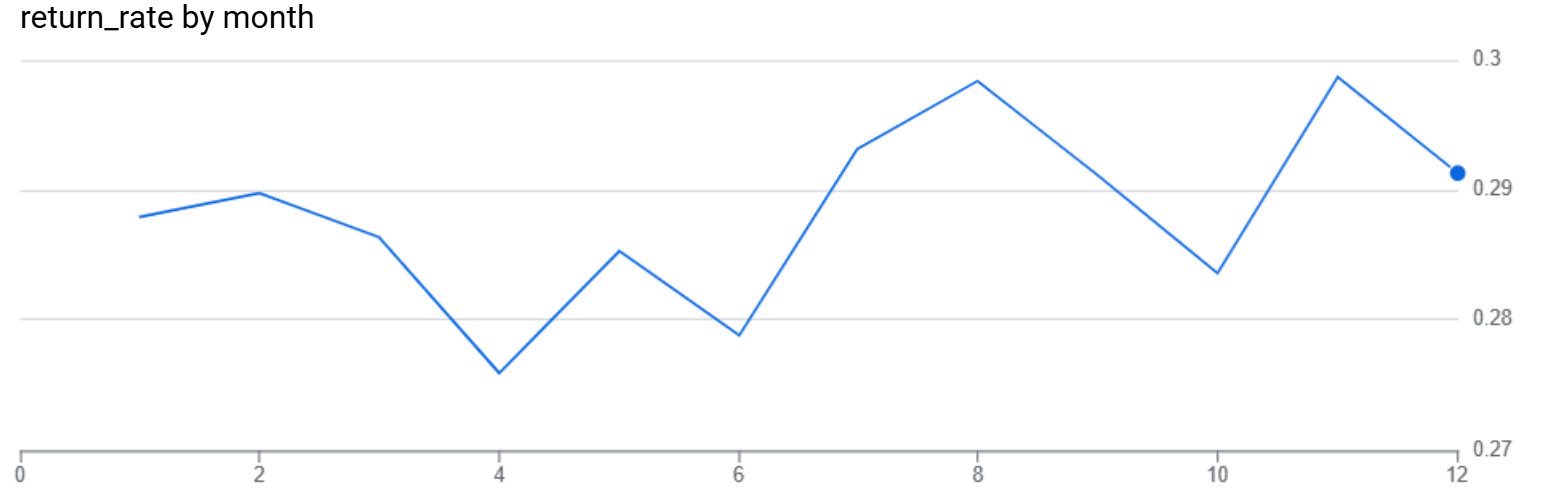
Analytical Insights & Business Recommendations
Seasonal aggregation reveals which months consistently generate higher or lower revenue and profit, independent of the long-term growth trend. For an e-commerce retailer selling apparel and accessories, we would expect demand peaks around fall/winter (September–December) driven by back-to-school, holiday gift-giving, and cold-weather outerwear purchases – aligning directly with the finding that Outerwear & Coats is the #1 revenue category. To capitalize on this, inventory orders should be timed to arrive 4–6 weeks before identified peak months. Since Outerwear & Coats dominates revenue with a $146.29 average sale price, ensuring adequate stock of premium jackets and coats before October is critical. Stockouts during peak demand months represent the highest opportunity cost in the business. The historical seasonal pattern can be used to build a demand forecasting model – even a simple moving average of monthly revenue by category would enable more precise purchase orders.
Different categories likely peak at different times: Outerwear & Coats and Sweaters before winter, Swim and Shorts before summer, Active wear potentially showing dual peaks (New Year's resolutions in January, pre-summer fitness in April/May). A category-specific promotional calendar should be built based on these seasonal patterns. Outerwear, Sweaters, and Blazers & Jackets (the top 3 margin categories) should be promoted during September–November when demand naturally peaks, while Swim, Shorts, and Active wear should be promoted during March–May as customers prepare for warm weather. Off-peak months for specific categories can be used for clearance sales and inventory reduction, particularly for seasonal items that would otherwise become dead stock.
The monthly units sold aggregation shows the rhythm of customer purchasing behavior across the year. Peak months for unit volume may differ from peak revenue months – a high-volume month dominated by lower-priced items (Intimates, Socks, Tops & Tees) would show high units sold but moderate revenue, while a month dominated by outerwear and jeans would show lower units but higher revenue per transaction. Seasonal units sold patterns should be used to staff fulfillment operations. If November and December show 30–50% more unit volume than average months, temporary fulfillment staff or extended shipping hours should be pre-arranged. The en-route rate data from the product and category analyses showed that 60–70% of orders are processing or shipping at any given time – during peak months, this backlog would grow unless fulfillment capacity scales proportionally.
If profit margins dip during specific months (e.g., post-holiday January, mid-summer July), it may indicate seasonal clearance discounting or markdown activity that compresses margins. Conversely, margin peaks likely coincide with periods when full-price purchases dominate (e.g., early fall when new inventory arrives). If seasonal margin analysis reveals consistent dips, the discounting strategy should be evaluated on a net basis. A 20% discount that drives a 40% increase in volume is net-positive, but a 20% discount that only drives a 15% volume increase destroys margin without recovering it through volume. The seasonal margin data can be used to set discount ceilings – never discount below the point where the volume increase fails to offset the margin compression.
Return rates may fluctuate seasonally for predictable reasons: holiday gift returns in January, sizing issues on cold-weather clothing purchased online, or impulse-buy returns during sale events. Understanding when returns spike helps plan reverse logistics capacity and refund budgets. If holiday months (November–December) show elevated return rates in January–February, reverse logistics and refund processing capacity should be scaled accordingly. Tightening the return window for sale/clearance items (which are already discounted and thus lower-margin) can reduce the return burden from impulse purchases. For seasonal categories like Outerwear where returns cost the most per unit ($146 avg sale price), investing in better product descriptions, fit guides, and user reviews specifically targeting the pre-peak season months is worthwhile.
The four seasonal metrics together – revenue, units, margin, and returns – create a predictive framework for the business year. Each metric informs a different operational lever: revenue patterns drive marketing budgets, unit patterns drive fulfillment staffing, margin patterns drive pricing strategy, and return patterns drive reverse logistics planning. A unified seasonal planning document should be built that maps each month to its expected demand profile and prescribes operational actions. For example: September → increase outerwear inventory and marketing spend; January → scale return processing and plan clearance events; March → begin summer category promotions. This transforms reactive operations into proactive, data-driven planning.
Customers
Top customers by generated Revenue
WITH first_layer AS (
	SELECT
		o.user_id AS customer_id,
		ROUND(SUM(CASE WHEN oi.status = 'Complete' THEN oi.sale_price ELSE 0
END), 2) AS generated_revenue,
		ROUND(SUM(CASE WHEN oi.status = 'Complete' THEN (oi.sale_price - p.cost)
ELSE 0 END), 2) AS generated_profit,
		COUNT(*) AS num_items_ordered,
		COUNT(DISTINCT o.order_id) AS num_orders,
		SUM(CASE WHEN oi.status = 'Returned' THEN 1 ELSE 0 END) AS
num_returned_items,
		SUM(CASE WHEN oi.status = 'Complete' THEN 1 ELSE 0 END) AS
num_completed_items,
SUM(CASE WHEN oi.status = 'Cancelled' THEN 1 ELSE 0 END) AS
num_cancelled_items,
COUNT(DISTINCT CASE WHEN o.status = 'Complete' THEN o.order_id END) AS
num_completed_orders,
MIN(o.created_at) AS first_order,
MAX(o.created_at) AS last_order
	FROM `bigquery-public-data.thelook_ecommerce.order_items` AS oi
JOIN `bigquery-public-data.thelook_ecommerce.orders` AS o
ON oi.order_id = o.order_id
JOIN `bigquery-public-data.thelook_ecommerce.products` AS p
ON oi.product_id = p.id
GROUP BY customer_id
)
, second_layer AS (
	SELECT
		*,
		ROUND((generated_revenue / NULLIF(num_completed_orders, 0)), 2) AS
avg_order_value,
		ROUND((num_items_ordered / NULLIF(num_orders, 0)), 2) AS avg_order_size,
		ROUND((num_returned_items / NULLIF((num_completed_items +
num_returned_items), 0)), 4) AS return_rate,
		DATE_DIFF(DATE(last_order), DATE(first_order), DAY) AS lifetime_days
	FROM first_layer
)
SELECT
	*,
	RANK() OVER(ORDER BY generated_revenue DESC) AS revenue_rank,
	RANK() OVER(ORDER BY generated_profit DESC) AS profit_rank,
	RANK() OVER(ORDER BY num_items_ordered DESC) AS num_items_ordered_rank,
	RANK() OVER(ORDER BY num_orders DESC) AS num_orders_rank,
	RANK() OVER(ORDER BY num_returned_items DESC) AS num_returned_items_rank,
	RANK() OVER(ORDER BY num_completed_items DESC) AS num_completed_items_rank,
	RANK() OVER(ORDER BY num_cancelled_items DESC) AS num_cancelled_items_rank,
	RANK() OVER(ORDER BY num_completed_orders DESC) AS
num_completed_orders_rank,
	RANK() OVER(ORDER BY first_order DESC) AS first_order_rank,
	RANK() OVER(ORDER BY last_order DESC) AS last_order_rank,
	RANK() OVER(ORDER BY avg_order_value DESC) AS avg_order_value_rank,
	RANK() OVER(ORDER BY avg_order_size DESC) AS avg_order_size_rank,
	RANK() OVER(ORDER BY return_rate DESC) AS return_rate_rank,
	RANK() OVER(ORDER BY lifetime_days DESC) AS lifetime_days_rank
FROM second_layer
ORDER BY revenue_rank ASC
LIMIT 15;| customer_id | generated_revenue | generated_profit | num_items_ordered | num_orders | num_returned_items | num_completed_items | num_cancelled_items | num_completed_orders | first_order | last_order | avg_order_value | avg_order_size | return_rate | lifetime_days | revenue_rank | profit_rank | num_items_ordered_rank | num_orders_rank | num_returned_items_rank | num_completed_items_rank | num_cancelled_items_rank | num_completed_orders_rank | first_order_rank | last_order_rank | avg_order_value_rank | avg_order_size_rank | return_rate_rank | lifetime_days_rank |
|---|---|---|---|---|---|---|---|---|---|---|---|---|---|---|---|---|---|---|---|---|---|---|---|---|---|---|---|---|
| 41791 | 1487.0 | 884.96 | 3 | 1 | 0 | 3 | 0 | 1 | 2022-09-28 04:15:35.000000 UTC | 2022-09-28 04:15:35.000000 UTC | 1487.0 | 3.0 | 0.0 | 0 | 1 | 1 | 15410 | 30074 | 12023 | 2050 | 17392 | 3350 | 62938 | 70428 | 1 | 2670 | 12023 | 29774 |
| 9608 | 1348.98 | 703.94 | 9 | 4 | 0 | 4 | 4 | 2 | 2022-06-02 13:50:09.000000 UTC | 2025-04-28 20:40:37.000000 UTC | 674.49 | 2.25 | 0.0 | 1061 | 2 | 3 | 148 | 1 | 12023 | 435 | 164 | 299 | 65844 | 37422 | 96 | 7921 | 12023 | 4750 |
| 58672 | 1327.33 | 688.92 | 6 | 2 | 0 | 4 | 0 | 1 | 2021-12-10 12:12:04.000000 UTC | 2025-09-11 22:33:43.000000 UTC | 1327.33 | 3.0 | 0.0 | 1371 | 3 | 4 | 2025 | 10016 | 12023 | 435 | 17392 | 3350 | 69626 | 27098 | 2 | 2670 | 12023 | 2338 |
| 6721 | 1303.55 | 708.33 | 6 | 3 | 0 | 5 | 0 | 2 | 2025-06-17 16:41:11.000000 UTC | 2026-02-18 00:34:38.000000 UTC | 651.77 | 2.0 | 0.0 | 246 | 4 | 2 | 2025 | 5093 | 12023 | 144 | 17392 | 299 | 23890 | 8652 | 100 | 8103 | 12023 | 18441 |
| 41139 | 1170.01 | 645.44 | 4 | 1 | 0 | 4 | 0 | 1 | 2025-08-23 10:04:29.000000 UTC | 2025-08-23 10:04:29.000000 UTC | 1170.01 | 4.0 | 0.0 | 0 | 5 | 5 | 8057 | 30074 | 12023 | 435 | 17392 | 3350 | 19645 | 28833 | 3 | 1 | 12023 | 29774 |
| 96233 | 1142.38 | 614.03 | 7 | 3 | 0 | 4 | 0 | 1 | 2025-09-02 02:54:09.000000 UTC | 2025-10-28 15:36:32.000000 UTC | 1142.38 | 2.33 | 0.0 | 56 | 6 | 8 | 887 | 5093 | 12023 | 435 | 17392 | 3350 | 19003 | 22776 | 4 | 7675 | 12023 | 25645 |
| 10218 | 1120.4 | 468.69 | 6 | 3 | 1 | 5 | 0 | 2 | 2026-02-22 01:11:21.000000 UTC | 2026-03-16 03:41:47.000000 UTC | 560.2 | 2.0 | 0.1667 | 22 | 7 | 67 | 2025 | 5093 | 4008 | 144 | 17392 | 299 | 5328 | 3464 | 128 | 8103 | 11983 | 27583 |
| 89840 | 1103.0 | 576.93 | 4 | 2 | 0 | 3 | 0 | 1 | 2024-12-07 22:57:33.000000 UTC | 2026-02-12 19:45:20.000000 UTC | 1103.0 | 2.0 | 0.0 | 432 | 8 | 14 | 8057 | 10016 | 12023 | 2050 | 17392 | 3350 | 34223 | 9545 | 5 | 8103 | 12023 | 13731 |
| 99402 | 1095.49 | 605.27 | 4 | 2 | 0 | 3 | 0 | 1 | 2024-06-22 08:20:14.000000 UTC | 2025-07-10 07:07:30.000000 UTC | 1095.49 | 2.0 | 0.0 | 383 | 9 | 9 | 8057 | 10016 | 12023 | 2050 | 17392 | 3350 | 41884 | 32315 | 6 | 8103 | 12023 | 14818 |
| 72421 | 1090.96 | 566.27 | 5 | 2 | 0 | 4 | 1 | 1 | 2023-09-13 12:47:43.000000 UTC | 2025-10-01 00:04:09.000000 UTC | 1090.96 | 2.5 | 0.0 | 749 | 10 | 16 | 4060 | 10016 | 12023 | 435 | 6078 | 3350 | 52560 | 25388 | 7 | 5779 | 12023 | 8282 |
| 31261 | 1079.88 | 634.52 | 4 | 1 | 0 | 4 | 0 | 1 | 2025-11-10 19:44:29.000000 UTC | 2025-11-10 19:44:29.000000 UTC | 1079.88 | 4.0 | 0.0 | 0 | 11 | 6 | 8057 | 30074 | 12023 | 435 | 17392 | 3350 | 14129 | 21355 | 8 | 1 | 12023 | 29774 |
| 92743 | 1072.99 | 563.61 | 2 | 1 | 0 | 2 | 0 | 1 | 2019-05-26 14:46:36.000000 UTC | 2019-05-26 14:46:36.000000 UTC | 1072.99 | 2.0 | 0.0 | 0 | 12 | 17 | 25303 | 30074 | 12023 | 4241 | 17392 | 3350 | 79749 | 79862 | 9 | 8103 | 12023 | 29774 |
| 58269 | 1061.94 | 515.49 | 5 | 3 | 0 | 4 | 1 | 2 | 2023-10-25 12:15:17.000000 UTC | 2025-10-24 12:12:28.000000 UTC | 530.97 | 1.67 | 0.0 | 730 | 13 | 42 | 4060 | 5093 | 12023 | 435 | 6078 | 299 | 51108 | 23151 | 143 | 21954 | 12023 | 8531 |
| 31221 | 1046.99 | 467.51 | 5 | 2 | 0 | 4 | 0 | 1 | 2023-09-22 16:05:02.000000 UTC | 2024-09-30 17:07:31.000000 UTC | 1046.99 | 2.5 | 0.0 | 374 | 14 | 68 | 4060 | 10016 | 12023 | 435 | 17392 | 3350 | 52246 | 49093 | 10 | 5779 | 12023 | 15040 |
| 90530 | 1039.66 | 618.49 | 7 | 4 | 0 | 4 | 1 | 1 | 2025-01-12 02:14:23.000000 UTC | 2025-11-14 14:49:28.000000 UTC | 1039.66 | 1.75 | 0.0 | 306 | 15 | 7 | 887 | 1 | 12023 | 435 | 6078 | 3350 | 32497 | 20944 | 11 | 21174 | 12023 | 16753 |
Customer segment Counts
WITH customer_order_counts AS (
  SELECT
    user_id,
    SUM(num_of_item) AS total_items
  FROM `bigquery-public-data.thelook_ecommerce.orders`
  GROUP BY user_id
),
bounds AS (
  SELECT
    MIN(total_items) AS min_items,
    MAX(total_items) AS max_items
  FROM customer_order_counts
),
segments AS (
  SELECT
    c.total_items,
    b.min_items,
    b.max_items,
    LEAST(
      FLOOR((c.total_items - b.min_items) / ((b.max_items - b.min_items) / 4.0)) + 1,
      4
    ) AS segment
  FROM customer_order_counts c
  CROSS JOIN bounds b
)
SELECT
  min_items,
  max_items,
  segment,
  ROUND(min_items + (segment - 1) * (max_items - min_items) / 4.0, 2) AS segment_start,
  ROUND(min_items + segment * (max_items - min_items) / 4.0, 2) AS segment_end,
  COUNT(*) AS num_customers
FROM segments
GROUP BY segment, min_items, max_items
ORDER BY segment;| min_items | max_items | segment | segment_start | segment_end | num_customers |
|---|---|---|---|---|---|
| 1 | 13 | 1.0 | 1.0 | 4.0 | 64554 |
| 1 | 13 | 2.0 | 4.0 | 7.0 | 13385 |
| 1 | 13 | 3.0 | 7.0 | 10.0 | 1877 |
| 1 | 13 | 4.0 | 10.0 | 13.0 | 147 |
Customer Geographics
SELECT
  u.country,
  COUNT(DISTINCT u.id) AS num_customers,
  COUNT(oi.id) AS units_sold,
  ROUND(SUM(oi.sale_price), 2) AS revenue,
  ROUND(SUM(oi.sale_price - p.cost), 2) AS profit
FROM
  `bigquery-public-data.thelook_ecommerce.order_items` oi
JOIN
  `bigquery-public-data.thelook_ecommerce.users` u
  ON oi.user_id = u.id
JOIN
  `bigquery-public-data.thelook_ecommerce.products` p
  ON oi.product_id = p.id
WHERE
  oi.status NOT IN ('Cancelled', 'Returned')
GROUP BY
  u.country
ORDER BY
revenue DESC;| country | num_customers | units_sold | revenue | profit |
|---|---|---|---|---|
| China | 22412 | 46162 | 2748111.08 | 1425885.25 |
| United States | 14926 | 30626 | 1824282.8 | 944656.58 |
| Brasil | 9618 | 19902 | 1186881.13 | 616746.55 |
| South Korea | 3433 | 7038 | 412219.82 | 213576.53 |
| France | 3137 | 6402 | 382581.48 | 198723.99 |
| United Kingdom | 3038 | 6343 | 376944.04 | 195623.13 |
| Germany | 2807 | 5713 | 348155.95 | 180505.4 |
| Spain | 2745 | 5541 | 334100.88 | 173307.63 |
| Japan | 1552 | 3153 | 188862.22 | 97987.7 |
| Australia | 1450 | 2967 | 177458.55 | 92306.6 |
| Belgium | 767 | 1666 | 96644.64 | 50128.32 |
| Poland | 155 | 301 | 16104.04 | 8341.83 |
| Colombia | 7 | 14 | 843.29 | 462.26 |
| Austria | 1 | 2 | 21.63 | 12.09 |
| España | 1 | 1 | 19.98 | 10.75 |
Analytical Insights & Business Recommendations
The customer segment count data reveals an extremely skewed distribution: 64,554 customers (80.7%) fall in Segment 1 (1–4 items ordered), 13,385 (16.7%) in Segment 2 (4–7 items), 1,877 (2.3%) in Segment 3 (7–10 items), and only 147 (0.2%) in Segment 4 (10–13 items). The overwhelming majority of customers are low-frequency, low-volume purchasers. This distribution is typical of e-commerce businesses but highlights a critical retention challenge: most customers are essentially one-time or two-time buyers. The top customer by revenue (customer #41791) generated $1,487 from a single order of 3 items – showing that high revenue comes from high-value items, not repeat purchasing. Implementing customer retention strategies targeting the Segment 1 customers (1–4 items) could yield significant results. Even moving 5% of these 64,554 customers into Segment 2 (by encouraging one additional order) would add ~3,228 returning customers. Tactics include post-purchase email campaigns with personalized product recommendations, loyalty discounts on second purchases, and targeted ads for complementary items based on initial purchase categories. The cost of retaining an existing customer is significantly lower than acquiring a new one.
The top 15 customers by revenue almost all share a profile: 1–4 orders, 3–7 items, and very high average order values ($500–$1,487). Most of these customers achieved top-15 status through a single large purchase of premium items rather than through repeat buying behavior. Customer #41791's $1,487 came from one order; customer #41139's $1,170 from one order of 4 items. Only customers #9608 and #6721 show multiple orders (4 and 3 respectively) with meaningful lifetime spans (1,061 and 246 days), suggesting they may be the closest to genuinely loyal, repeat customers among the top earners. The high-value, single-order customers represent both an opportunity and a risk. They contribute outsized revenue but are fragile – if they don't return, their lifetime value is capped at one transaction. Targeting these customers with VIP-style retention – exclusive early access to new premium products, personalized thank-you communications, and loyalty incentives calibrated to their demonstrated willingness to spend ($500+) – could be highly effective. Even converting 20% of them into two-order customers would significantly impact revenue.
China dominates customer geography with 22,412 customers generating $2,748,111.08 in revenue – more than the next two countries combined. The United States follows with 14,926 customers and $1,824,282.80, then Brazil with 9,618 customers and $1,186,881.13. These three countries account for the vast majority of the customer base. The per-customer revenue is relatively consistent across major markets ($122–$131 per customer for the top 5 countries), suggesting that spending behavior doesn't vary dramatically by geography – the differences in total revenue are driven by customer count, not average spending. Identifying the top-demand products for each customer country and advertising accordingly is recommended. Chinese customers, representing the largest market, should see product recommendations optimized for their browsing and purchasing patterns. Logistics and shipping optimization should prioritize the China, US, and Brazil shipping corridors since they represent the overwhelming majority of order volume. For smaller but growing markets (South Korea, France, UK, Germany, Spain), investing in localized product pages and regional marketing to grow customer counts toward critical mass would be beneficial.
Distribution Centers
Distribution center performance
SELECT
  dc.name AS distribution_center,
  COUNT(oi.id) AS total_units,
  ROUND(SUM(oi.sale_price), 2) AS revenue,
  ROUND(SUM(oi.sale_price) - SUM(p.cost), 2) AS profit,
  ROUND(
    COUNTIF(oi.status = 'Processing') / COUNT(oi.id) * 100, 2
  ) AS processing_pct
FROM
  `bigquery-public-data.thelook_ecommerce.order_items` oi
JOIN
  `bigquery-public-data.thelook_ecommerce.products` p
  ON oi.product_id = p.id
JOIN
  `bigquery-public-data.thelook_ecommerce.distribution_centers` dc
  ON p.distribution_center_id = dc.id
GROUP BY
  dc.name
ORDER BY
total_units DESC;| distribution_center | total_units | revenue | profit | processing_pct |
|---|---|---|---|---|
| Memphis TN | 24282 | 1417936.76 | 742425.78 | 20.27 |
| Chicago IL | 23835 | 1321943.15 | 692110.99 | 19.83 |
| Houston TX | 22829 | 1600413.73 | 853992.03 | 19.59 |
| Mobile AL | 18515 | 1242396.82 | 634302.9 | 20.18 |
| Los Angeles CA | 17274 | 949866.99 | 489442.35 | 19.71 |
| Charleston SC | 16636 | 662246.68 | 334984.25 | 19.85 |
| Philadelphia PA | 16568 | 1065642.92 | 542109.66 | 19.58 |
| Port Authority of New York/New Jersey NY/NJ | 16388 | 933800.14 | 483299.71 | 20.23 |
| New Orleans LA | 12816 | 786466.54 | 414082.5 | 19.47 |
| Savannah GA | 11954 | 799532.26 | 405281.54 | 20.25 |
Distribution center inventory
WITH product_sales AS (
  SELECT
    p.id AS product_id,
    p.distribution_center_id,
    COUNT(oi.id) / GREATEST(DATE_DIFF(CURRENT_DATE(), MIN(DATE(oi.created_at)), DAY), 1) AS daily_sales_rate
  FROM
    `bigquery-public-data.thelook_ecommerce.products` p
  LEFT JOIN
    `bigquery-public-data.thelook_ecommerce.order_items` oi
    ON p.id = oi.product_id
  GROUP BY
    p.id, p.distribution_center_id
),


inventory AS (
  SELECT
    id AS product_id,
    product_distribution_center_id,
    COUNT(*) AS stock_on_hand
  FROM
    `bigquery-public-data.thelook_ecommerce.inventory_items`
  WHERE
    sold_at IS NULL
  GROUP BY
    id, product_distribution_center_id
),


product_status AS (
  SELECT
    ps.distribution_center_id,
    CASE
      WHEN SAFE_DIVIDE(COALESCE(i.stock_on_hand, 0), ps.daily_sales_rate) > 90 THEN 'Overstocked'
      WHEN SAFE_DIVIDE(COALESCE(i.stock_on_hand, 0), ps.daily_sales_rate) < 14 THEN 'Understocked'
    END AS stock_status
  FROM
    product_sales ps
  LEFT JOIN
    inventory i
    ON ps.product_id = i.product_id
    AND ps.distribution_center_id = i.product_distribution_center_id
)


SELECT
  dc.name AS distribution_center,
  COUNTIF(stock_status = 'Overstocked') AS overstocked_products,
  COUNTIF(stock_status = 'Understocked') AS understocked_products,
  COUNTIF(stock_status IS NOT NULL) AS total_flagged_products
FROM
  product_status ps
JOIN
  `bigquery-public-data.thelook_ecommerce.distribution_centers` dc
  ON ps.distribution_center_id = dc.id
GROUP BY
  dc.name
ORDER BY
total_flagged_products DESC;| distribution_center | overstocked_products | understocked_products | total_flagged_products |
|---|---|---|---|
| Chicago IL | 311 | 3595 | 3906 |
| Memphis TN | 298 | 3576 | 3874 |
| Houston TX | 294 | 3356 | 3650 |
| Mobile AL | 188 | 2719 | 2907 |
| Los Angeles CA | 162 | 2588 | 2750 |
| Charleston SC | 160 | 2545 | 2705 |
| Philadelphia PA | 155 | 2501 | 2656 |
| Port Authority of New York/New Jersey NY/NJ | 151 | 2414 | 2565 |
| New Orleans LA | 92 | 2014 | 2106 |
| Savannah GA | 70 | 1805 | 1875 |
Analytical Insights & Business Recommendations
Houston TX generates the most revenue ($1,600,413.73) and profit ($853,992.03) across all distribution centers, despite ranking only #3 in total units shipped (22,829). This means Houston is processing higher-value products – likely premium outerwear, jeans, and suits that dominate the top-revenue categories. By comparison, Memphis TN ships the most units (24,282) but generates $182K less revenue than Houston, indicating Memphis handles more lower-price-point items.
Recommendation: Given Houston's revenue leadership, ensure this facility has priority access to premium inventory (Outerwear & Coats, Suits & Sport Coats, Blazers & Jackets – the three highest-margin categories). Operational disruptions at Houston would disproportionately impact the business's bottom line. Consider allocating additional quality control resources to Houston since its higher-value shipments have greater per-unit revenue risk if damaged or delayed.
Processing percentages across all 10 distribution centers fall in a tight band of 19.47%–20.27%, suggesting that order processing capacity and speed are consistent across the network. No single facility is significantly bottlenecked or outperforming others in throughput.
Recommendation: The uniform ~20% processing rate raises a question: is this the optimal throughput, or is every facility equally constrained by the same bottleneck (e.g., a shared technology platform, standardized staffing model, or common shipping carrier limitations)? Investigate whether shipping routes and processing practices across the network can be optimized – even a 1 percentage point improvement in processing speed across all 10 facilities, moving more orders from processing to shipped faster, would reduce the window for customer cancellations (which were identified as a significant source of lost revenue in the product and brand analyses).
The inventory analysis reveals a dramatic imbalance: across all distribution centers, understocked products outnumber overstocked products by roughly 10:1. Chicago IL has 3,595 understocked products vs. 311 overstocked; Memphis TN has 3,576 understocked vs. 298 overstocked. This pattern is consistent across every facility.
Understocking means products with active demand don't have enough inventory to meet expected sales velocity, leading to potential stockouts, lost revenue, and disappointed customers. Given that the product-level analysis showed high-value items like The North Face, Canada Goose, and Diesel driving outsized revenue per unit, a stockout on these items has far greater revenue impact than on low-price basics.
Recommendation: The widespread understocking is the most actionable finding in the distribution center analysis. Prioritize replenishment for the highest-revenue and highest-margin products first – ensure Outerwear & Coats, Suits & Sport Coats, and Blazers & Jackets (the top 3 margin categories) are fully stocked before allocating capital to lower-margin items. Demand can be tracked and forecasted using the historical sales data and seasonal patterns identified in the trends sections to build more accurate reorder points and safety stock levels.
While understocking dominates, each facility does carry 70–311 overstocked products. These are items where inventory exceeds 90 days of projected sales at current velocity – capital tied up in slow-moving merchandise that could be allocated to higher-demand items.
Recommendation: Identify the specific overstocked products at each facility and cross-reference with the bottom products and bottom brands analyses. Products that are overstocked AND appear in the zero-revenue or low-demand lists should be candidates for clearance pricing or return to supplier. Products that are overstocked but have decent margins may simply need promotional support to accelerate their sell-through rate – targeted advertising or bundle deals could move excess inventory before it becomes obsolete.
With 10 distribution centers across the southeastern and eastern US (Memphis, Chicago, Houston, Mobile, LA, Charleston, Philadelphia, NY/NJ, New Orleans, Savannah), the network is heavily weighted toward the eastern half of the country. Given that the customer geography data shows China and Brazil as the #1 and #3 customer countries, the domestic distribution network may be serving international shipping corridors differently than domestic ones.
Recommendation: Evaluate whether the current distribution center footprint optimally serves the geographic customer mix. If the majority of US orders originate from certain regions, ensure inventory is positioned at the nearest facility rather than evenly distributed. For international shipments (especially to China, the largest market), identify which port-adjacent facilities (LA, Houston, NY/NJ) are most efficient for international fulfillment and consider concentrating international-bound inventory at those locations to reduce domestic transit time before international shipping.
The distribution center network as a whole has room for shipping and transit cost optimization. With high en-route rates (60–70% of non-cancelled, non-returned orders) observed across products and categories, a meaningful portion of the business's inventory is constantly in transit between facilities and customers.
Recommendation: Investigate whether shipping routes between facilities and major customer hubs can be consolidated or optimized. For high-volume brands (Calvin Klein with 3,180 orders, Allegra K with 6,057 orders, Carhartt with 2,509 orders), it may be more efficient to position their inventory at specific facilities closest to their customer demand centers rather than spreading it across all 10 locations. This reduces inter-facility transfers and shortens last-mile delivery times, improving both cost efficiency and customer satisfaction.
Conclusion
Key Findings
Across ten analytical dimensions – products, brands, categories, trends, customers, and distribution centers – several findings emerged that would be critical for any business stakeholder evaluating this retailer's performance.
Revenue concentration in premium categories: Outerwear & Coats generates $339,222 in revenue – ranking #1 – with only 9,028 unit orders, which ranks #10 by volume. This proves that premium categories drive disproportionate revenue per unit. The top 2 categories (Outerwear & Jeans) account for approximately 24% of total revenue, meaning a quarter of the business depends on just two product lines.
Margin diverges sharply from revenue: Blazers & Jackets has the highest profit margin at 62.1% but ranks only #15 in revenue – the most profitable category per dollar sold is one of the lower-volume ones. Conversely, Jeans ranks #2 in revenue but #21 in margin at 46.5%. A strategy optimized for revenue looks fundamentally different from one optimized for profitability.
Return rates are systemic, not category-specific: Return rates across all 26 categories fall within a tight 27–31% band, suggesting the approximately 28% baseline is driven by platform-level factors – return policy, product photography, sizing tools – rather than category-specific quality issues. This is a critical finding because it means platform-wide UX improvements would compound across the entire catalog, whereas targeted product-level fixes would have limited impact.
Lost revenue rivals earned revenue: For nearly every top product, brand, and category, lost revenue from returns and cancellations approaches or exceeds actual completed revenue. Diesel leads all brands in lost revenue ($49,754) against earned revenue of $53,774. Reducing the return and cancellation rate by even 2 percentage points would meaningfully increase net revenue across the business.
The customer base is overwhelmingly single-purchase: 80.7% of customers (64,554 of 79,963) ordered only 1–4 items total. The top revenue customer generated $1,487 from a single order. Retention and repeat purchasing represent the largest untapped growth lever – the business is acquiring customers effectively but not converting them into repeat buyers.
Distribution centers are systematically understocked: Across all 10 facilities, understocked products outnumber overstocked products by approximately 10:1. Chicago alone has 3,595 understocked items versus 311 overstocked – meaning potential revenue is being lost to stockouts at scale. This is an operational problem with a direct revenue impact.
Zero-revenue products consume resources: Multiple products and brands generated $0 in completed revenue despite having orders placed – 100% of their orders were returned, cancelled, or remain in transit. These items occupy inventory space and processing bandwidth without contributing any revenue.
Geographic concentration: Three countries (China, United States, Brazil) account for the vast majority of revenue, with per-customer spending relatively uniform across geographies at $122–$131 per customer in the top 5 markets. This suggests that demand patterns are consistent internationally but that revenue growth is constrained to a small number of markets.
Highest-Impact Recommendations
Synthesizing the findings across all ten analytical sections, the following actions would generate the greatest business value if implemented. These are ordered by estimated impact – the first recommendation alone would affect every category, brand, and product in the catalog.
1. Invest in platform-wide return reduction. Implement improved sizing tools, enhanced product photography, and virtual try-on capabilities. The uniform ~28% return rate across all 26 categories means a single platform improvement compounds across the entire catalog. A 2-point reduction in return rate would recover thousands of currently-lost orders and directly increase net revenue without requiring any new customer acquisition.
2. Rebalance distribution center inventory. Address the 10:1 understocking-to-overstocking ratio immediately, prioritizing the highest-revenue and highest-margin categories – Outerwear & Coats, Suits & Sport Coats, and Blazers & Jackets – to prevent stockouts on items with $100–$150 average revenue per unit. Every stockout on a premium item is a high-value sale lost.
3. Implement customer retention campaigns targeting single-purchase customers. The 64,554 customers who purchased only 1–4 items represent a massive re-engagement opportunity. Even converting 5% into repeat buyers adds approximately 3,200 returning customers – significantly cheaper than equivalent new customer acquisition and with higher expected lifetime value.
4. Negotiate supplier costs for high-volume, low-margin brands. Diesel (1,466 orders, 50.2% margin), Wrangler (1,287 orders, 47.2% margin), and the denim category broadly exhibit structural margin compression. The volume leverage with these suppliers is significant and should be used to renegotiate cost-of-goods to bring margins closer to the catalog average.
5. Delist zero-revenue products and brands. Products with 3 or more orders and $0 in completed revenue are consuming inventory space, warehouse capacity, and fulfillment bandwidth for no return. Catalog pruning would simplify operations, reduce carrying costs, and improve the customer browsing experience by removing items that consistently fail to convert.
6. Prioritize marketing spend on high-margin categories. A $1 increase in Blazers & Jackets demand yields $0.62 in profit versus $0.44 for Tops & Tees. Advertising ROI is structurally higher for high-margin categories, meaning the same marketing budget generates more profit when directed toward these product lines.
7. Build seasonal inventory planning using trend data. Front-load outerwear and sweater inventory before fall/winter peak demand, scale fulfillment staffing for identified high-volume months, and time clearance events to align with the demand troughs visible in the seasonal analysis. Proactive inventory planning based on these patterns would reduce both stockouts and overstock carrying costs.
Analytical Approach & What This Demonstrates
This project was designed to demonstrate the kind of analysis a data analyst performs in practice – not isolated queries answering single questions, but a systematic, multi-dimensional examination of an entire business from the data layer up.
Multi-dimensional analysis: Every entity – product, brand, category – was examined from 6–8 metric perspectives simultaneously (revenue, profit, margin, volume, return rate, lost revenue, and more) rather than just one. This mirrors real analyst work where a product can look excellent on revenue but terrible on margin, or a brand can lead in profit but hemorrhage returns. Single-metric analysis leads to bad decisions; multi-dimensional analysis reveals trade-offs.
Paired top/bottom analysis: Analyzing only top performers gives an incomplete picture. The "Bottom" sections reveal where the business is bleeding – zero-revenue products, margin-compressing categories, and dead-weight brands. Identifying what to stop doing is as valuable as identifying what to double down on, and this paired structure ensures both sides are examined.
Layered CTE architecture: The consistent first_layer → second_layer → third_layer CTE pattern demonstrates a real-world query design approach where complex metrics are built incrementally. Each layer has a clear purpose: aggregate raw data, derive ratios and calculated metrics, then rank and filter. This produces readable, maintainable, and auditable SQL that another analyst can pick up and extend without reverse-engineering the logic.
Recommendations grounded in data: Every recommendation in this project ties directly to a specific finding with a specific number. "Reduce return rates" is vague; "reduce the platform-wide ~28% return rate that is uniformly distributed across all 26 categories, suggesting platform-level UX as the root cause" is actionable and defensible. Data-driven recommendations require this level of specificity to be credible.
SQL as the right tool for the job: This entire analysis – joining six tables, computing conditional aggregations, building multi-layer derived metrics, ranking across 29,000+ products and 2,700+ brands – was accomplished purely in SQL. No data was exported for processing in another tool. This demonstrates that SQL is not just a "data extraction" language but a full analytical engine capable of end-to-end business analysis when used with intention and structure.
Limitations & Future Work
Analytical maturity includes knowing the boundaries of your own work. The following limitations are important context for interpreting the findings above.
Synthetic dataset: thelook_ecommerce is Google's synthetic dataset, not real company data. Some pricing anomalies exist – for example, socks listed at $903, which are presumably data generation artifacts. The analytical methodology is sound and fully transferable to real datasets, but the specific dollar figures are illustrative rather than representative of a real retailer.
No cost-of-operations data: The analysis calculates product-level profit (sale price minus product cost) but cannot account for fulfillment costs, marketing spend, overhead, or return processing costs. A real-world version of this analysis would incorporate these to produce true net profitability figures and more accurate ROI calculations for the recommendations.
No customer journey data: The dataset lacks clickstream, page-view, cart-abandonment, or marketing attribution data. Customer analysis is limited to transactional behavior (orders, returns, cancellations) rather than full funnel analysis. Understanding why customers don't return would require data this dataset does not contain.
Time-series stationarity not tested: The long-term and seasonal trend analyses identify patterns visually but do not apply statistical tests for trend significance or seasonality decomposition. A more rigorous approach would use time-series methods – moving averages, decomposition, or forecasting models – which is beyond SQL's native capabilities and better suited to Python or R.
No A/B testing or causal inference: All findings are correlational. Recommendations like "improve sizing tools to reduce returns" are grounded in observed patterns but would need controlled experiments to validate causal impact before committing significant resources.
Potential future extensions: This analysis could be extended with customer cohort and retention analysis (tracking repeat purchase behavior over time), RFM segmentation (Recency, Frequency, Monetary value scoring), market basket analysis (which products are frequently purchased together), or predictive modeling for return probability – each of which would require tools beyond SQL and would build naturally on the foundation established here.
Tools Used
- Google BigQuery – cloud data warehouse, Standard SQL dialect
- BigQuery public dataset:
bigquery-public-data.thelook_ecommerce - No external tools: All analysis performed entirely within SQL – no data export, no spreadsheet processing, no visualization libraries. Charts in the Long Term Trends and Seasonal Trends sections were produced separately from query result exports, but all underlying analysis is SQL-native.