College Match Finder
College Match Finder is an interactive college recommendation tool that scores and ranks U.S. institutions against a student’s personal priorities – academics, cost, outcomes, and career trajectory. Try it at nadeaujonnycollegematchfinder.streamlit.app – source on GitHub. Built for students, parents, and college counselors, it pulls from 12 federal and labor-market data sources to surface schools that match what a student actually cares about, not just the national rankings.
Stack: Streamlit · Python (pandas, plotly, fpdf2) · 12 federal and labor-market data sources · deployed on Streamlit Community Cloud
Data Sources
The app draws from 12 federal and labor-market datasets, grouped into five categories. Full per-source provenance – snapshot dates, DOI/download URLs, and methodology notes – is in the live app's About the Data expander on every tab.
- Schools (2 sources). College Scorecard Institution-Level data (October 2025 release) drives the School Finder's scoring dimensions: admissions, enrollment, test scores, net prices, graduation rates, and earnings. College Scorecard Field of Study data (April 2025) provides program-level 1-year and 5-year graduate earnings and median debt, displayed in school detail cards and the Major Explorer.
- Majors (3 sources). The NCES CIP–SOC Crosswalk (CIP 2020 edition) maps academic programs to BLS occupations. Sixty top-enrolled majors have hand-authored descriptions; the remaining ~350 use auto-generated stubs. A derived Major Outcomes table aggregates wage, growth, and openings data per CIP4 code.
- Careers (3 sources). BLS Occupational Employment and Wage Statistics (OEWS, May 2024) provides wage percentiles by occupation. BLS Employment Projections (2024–2034 cycle) contributes 10-year growth rates and annual openings. BLS NAICS-by-SOC industry distribution data (May 2024) powers the "Top industries" panel in Major Explorer.
- Geography (1 source). BLS OEWS State-Level data (May 2024) feeds the geographic concentration choropleth – both raw employment counts and location quotient relative to the national average.
- Interests (3 sources). O*NET 30.2 Work Context data (February 2026) drives the Work Environment quartile-bar panel. O*NET 30.2 RIASEC Interest Profiles (February 2026) power the Find Your Fit questionnaire matching. NY Fed Labor Market Outcomes for Recent College Graduates (February 4, 2026 release) provides unemployment, underemployment, and early/mid-career wage benchmarks by broad major.
Data ranges from May 2024 (BLS OEWS national/state/industry) through February 2026 (O*NET 30.2, NY Fed). The Clery Act campus safety dataset was evaluated and scoped out – see Methodology Decisions below.
Features
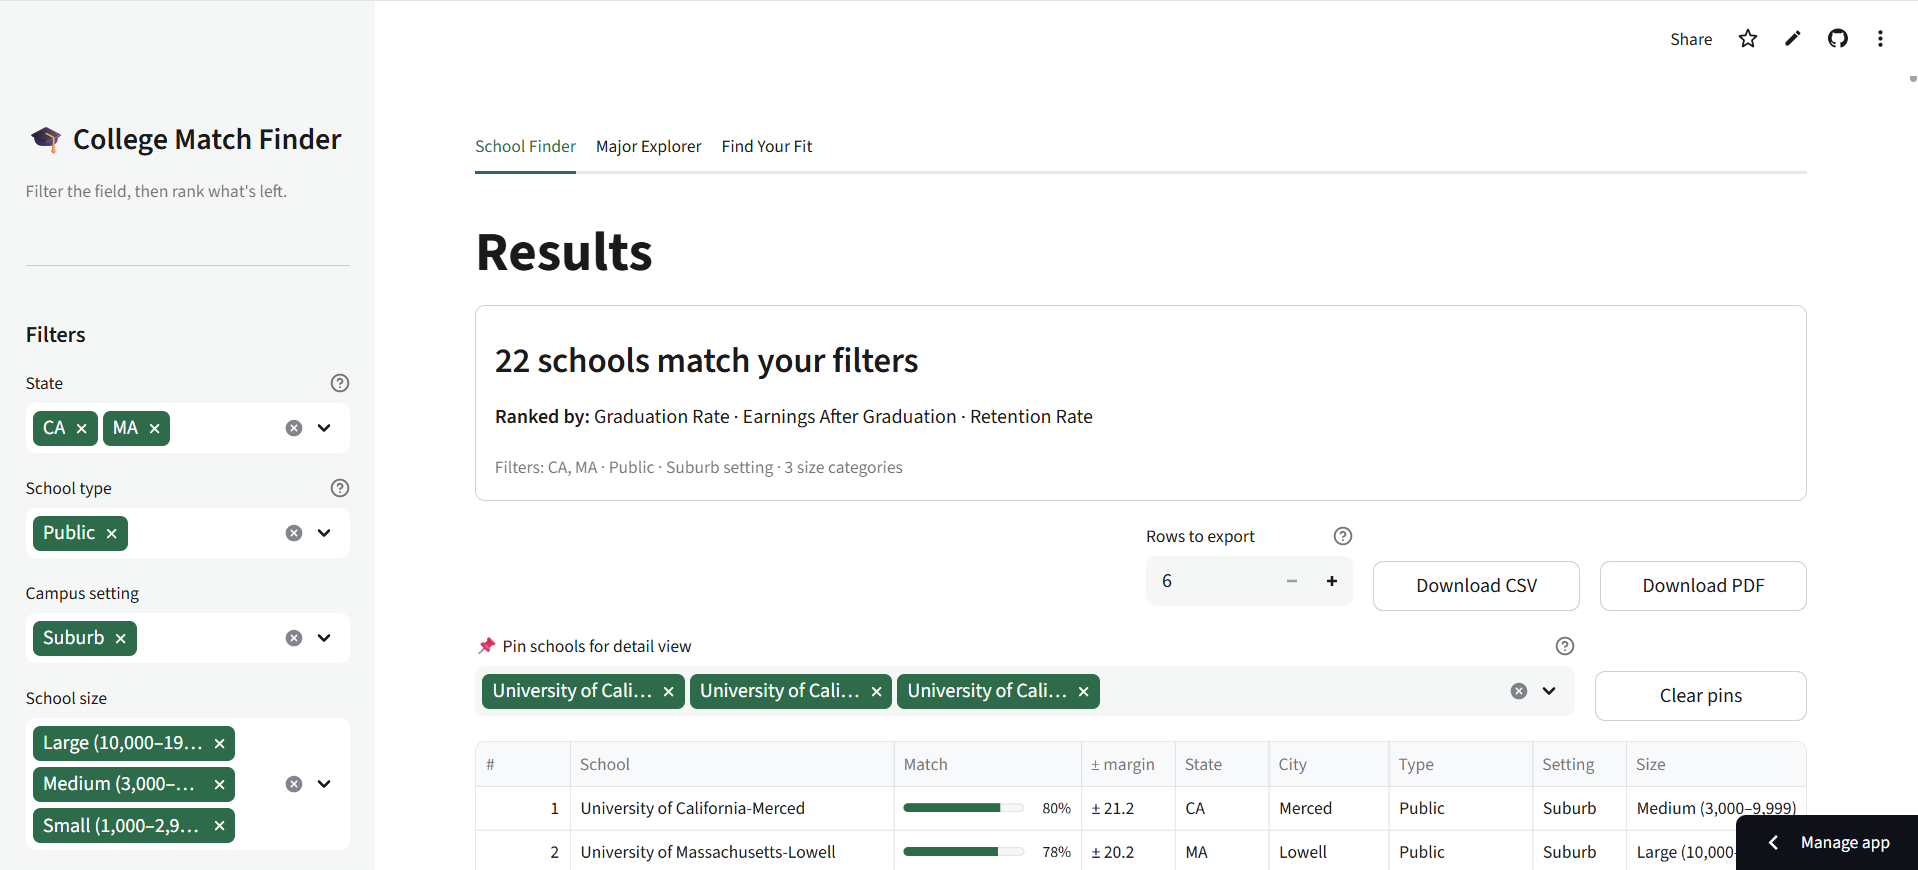
School Finder – ranking and discovery. Users set sliders for seven priorities (academic selectivity, cost, graduation rate, earnings outcomes, student-to-faculty ratio, retention, and loan repayment rate) and apply filters for state, institution type, enrollment size, and major. The app scores every institution in the filtered pool on a weighted percentile scale – 100 = best in the filtered field on your weights – and returns a ranked list with match scores, acceptance-likelihood badges (Safety / Match / Reach), and a confidence interval bar for each score.
Schools can be pinned to a detail panel that shows a percentile radar chart, student body demographics, earnings mobility by family income quartile, and program-level earnings and debt for the major currently selected in the Major Explorer. A sensitivity analysis flag marks whether a pinned school's rank is robust or volatile to small weight adjustments.
Comparison, export, and map. Up to four pinned schools can be compared side-by-side in a scrollable table covering all scoring dimensions, admissions, outcomes, and net prices by income bracket. Rankings and comparison data export to CSV or a formatted PDF report. A scattermapbox plot shows all ranked schools geographically, sized by match score.
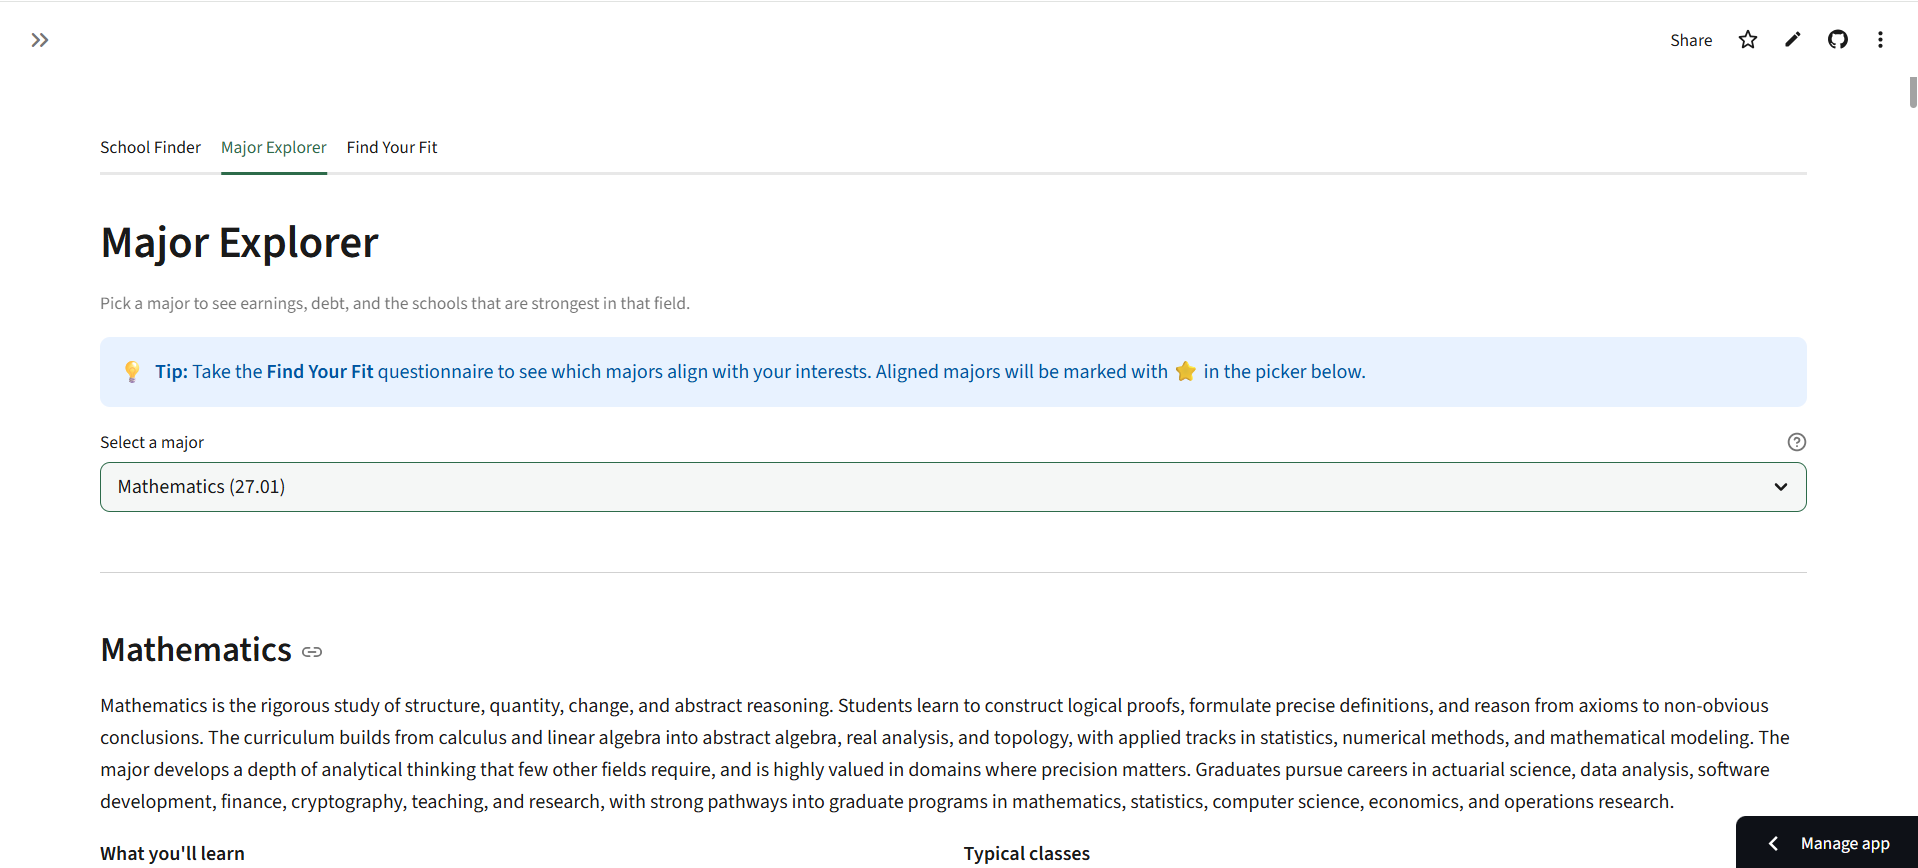
Major Explorer. Select any of ~410 CIP4 majors to see: a hand-authored description, program-level Scorecard earnings and debt for schools strong in that major, BLS wage percentiles and 10-year employment projections, the top industries by employment share, a state-level employment choropleth, NY Fed labor-market outcomes benchmarks, and a work-environment quartile panel. Schools strong in the selected major can be pinned directly to the School Finder from this tab.
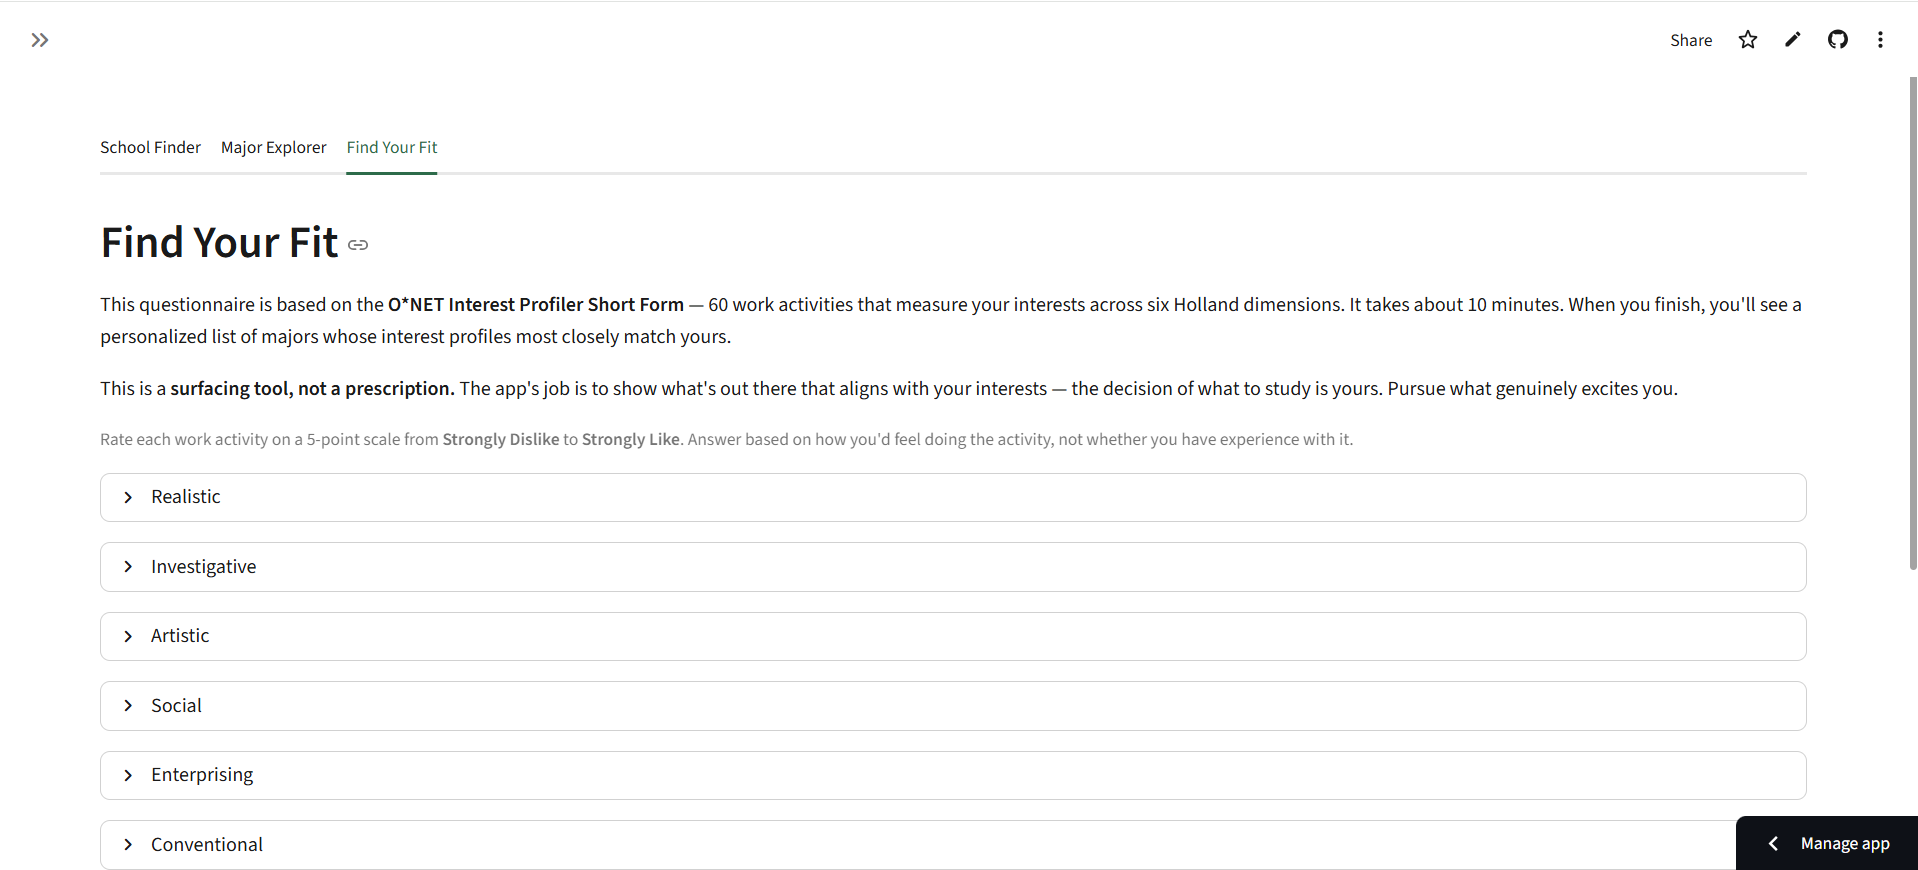
Find Your Fit – RIASEC major discovery. A 60-question interest inventory scores the user across the six RIASEC dimensions (Realistic, Investigative, Artistic, Social, Enterprising, Conventional). The app compares the resulting profile against O*NET RIASEC scores for all ~410 majors – aggregated by employment-weighted average across each major's routing occupations – and returns a ranked list of the ten best-matching majors. Any recommendation can be opened directly in Major Explorer with one click.
Methodology Decisions
Clery Act safety scoring – scoped out. Campus safety data from the U.S. Department of Education's Clery Act reporting was evaluated as a potential eighth scoring dimension and cut. Three compounding data-quality problems made it unsuitable: reporting is self-certified by institutions with no independent audit, crime geography (on-campus only) doesn't match the environment students actually inhabit, and normalizing by enrollment produces rates that are highly sensitive to how aggressively a school classifies incidents. The result would look like a safety signal but would mostly reflect institutional reporting culture. The feature is documented in config.py as a commented-out scope cut so it's easy to revisit if a cleaner source becomes available.
250-student enrollment floor. Institutions with fewer than 250 undergraduates are excluded from the default pool (a "Show small schools" toggle re-includes them). The threshold came from observing that tiny institutions dominate the top of retention- and graduation-sorted rankings – not because they're exceptional, but because small-cohort statistics are noisy and the schools aren't meaningfully comparable to the universities most users are evaluating. The floor is a data-quality decision, not a value judgment about small colleges.
Weighted median as a population statistic. Major-level wage figures are employment-weighted medians across the routing occupations for a CIP code – they describe where the labor market concentrates graduates in aggregate, not what any individual graduate will earn. A Computer Science major can become a postsecondary teacher; the weighted median doesn't predict their outcome. This framing is stated explicitly in the app's About the Data expander.
CIP–SOC crosswalk is expert judgment, not placement data. The NCES crosswalk that connects academic programs to occupations reflects BLS and NCES judgment about which jobs require a given program's skills. It is not based on actual graduate tracking. Real destination data would be richer but isn't publicly available at this granularity. The crosswalk is accurate enough to be useful for discovery – it just shouldn't be read as "graduates of this program become these workers."
Wong (2011) colorblind palette and WCAG contrast. The app uses a colorblind-safe palette derived from Wong (2011) throughout. Eight of those tokens fail WCAG AA non-text contrast (3:1) against a white background. Replacing them with darker variants would pass the contrast threshold but re-introduce colorblindness ambiguity – the two design goals conflict and there's no resolution that satisfies both simultaneously. The decision: replace colors where there's no colorblind constraint (the quartile gradient), preserve the Wong tokens where the constraint is real, and document the trade-off explicitly. Full detail in ACCESSIBILITY.md.
Engineering Decisions / Code Highlights
Single source of truth for scoring. Pinned schools appear in two places: the detail cards panel and the comparison table. Without a shared computation, the two views could show different scores for the same school if filter state changed between renders. _build_pinned_scored_pool is a shared helper that both call – it folds any pinned-but-outside-filter schools into the scoring pool before running compute_scores once, so the numbers are always identical regardless of which view you look at.
def _build_pinned_scored_pool(
    pinned_names: list[str],
    filtered: pd.DataFrame,
    full_df: pd.DataFrame,
    weights: dict,
) -> tuple[pd.DataFrame, set[str]]:
    """
    Shared by render_comparison and render_pinned_cards so both views
    always show identical numbers.
    """
    pinned_rows = full_df[full_df["school_name"].isin(pinned_names)]
    missing_from_filtered = pinned_rows[
        ~pinned_rows["school_name"].isin(filtered["school_name"])
    ]
    scoring_pool = pd.concat([filtered, missing_from_filtered], ignore_index=True)
    scoring_pool = scoring_pool.drop_duplicates(subset=["school_name"], keep="first")
    scored_pool = compute_scores(scoring_pool, weights, income_bracket_column=income_col)
    outside_filter_names = set(missing_from_filtered["school_name"].tolist())
    return scored_pool, outside_filter_names
Latin-1 helper over a heavier Unicode dependency. PDF export uses fpdf2's built-in Helvetica, which is Latin-1 only. Rather than bundling a full Unicode font (adds ~2 MB to the deployment, complicates Streamlit Cloud setup), _pdf_safe() normalizes any string to Latin-1 before it reaches the renderer: explicit replacements for common typographic characters, NFKD decomposition to strip combining marks, then a final encode/decode pass to drop anything still untranslatable. It covers the vast majority of U.S. college names and major titles without a production dependency.
def _pdf_safe(text: object) -> str:
    """
    Return a Latin-1-safe version of `text` suitable for fpdf2's Helvetica.

    1. Coerce to string.
    2. Apply the explicit replacement table for common typographic chars.
    3. NFKD-normalize and drop combining marks (so "é" -> "e", "ñ" -> "n").
    4. Encode/decode through latin-1, ignoring anything still untranslatable.
    """
    if text is None:
        return ""
    s = str(text)
    for src, dst in PDF_CHAR_REPLACEMENTS.items():
        if src in s:
            s = s.replace(src, dst)
    s = unicodedata.normalize("NFKD", s)
    s = s.encode("latin-1", errors="ignore").decode("latin-1")
    return s
The cross-tab bug 296 tests had missed. During final manual verification, clicking Explore → from a school detail card navigated to the Major Explorer tab but left the major picker stuck on its previous selection rather than pre-selecting the intended major. All 296 tests were passing. Automated tests don't exercise Streamlit's widget initialization sequence – that's not a test-suite failure, it's a boundary the suite can't reach. The root cause: set_major_explorer_cip() wrote the target CIP code to session state but didn't clear the widget's own key ("major_picker_widget"). When a Streamlit st.selectbox carries a key= argument, a persisted value under that key silently overrides the programmatic index parameter on the next render. The fix is one line in the callback – pop the widget key so Streamlit re-initializes from the index. A regression test was added before Phase 6 closed, bringing the total to 297.
def set_major_explorer_cip(cip4_str: str) -> None:
    """Pre-select a CIP4 in the Major Explorer tab."""
    st.session_state[SELECTED_CIP_KEY] = parse_cip_code(cip4_str)
    st.session_state["_last_xtab_cip"] = cip4_str
    st.session_state["_active_tab"] = "major_explorer"
    st.session_state.pop("major_picker_widget", None)  # clears widget-key shadow
Accessibility
Contrast for every chart color token in config.PALETTE is verified programmatically against its rendering background using WCAG 2.1 §1.4.3 math – 26 parametrized tests in the test suite catch any future palette regression before it ships.
Eight tokens derived from the Wong (2011) colorblind-safe palette fail WCAG AA non-text contrast (3:1) against white. They are excluded from the contrast tests with documented reasoning: replacing them with darker variants would pass the luminance threshold but re-introduce colorblindness ambiguity. The trade-off is recorded in the test file's EXCLUDED_TOKENS dict with each token's measured contrast ratio. See ACCESSIBILITY.md for full detail.
Lighthouse audit (Chrome, Mobile preset, local app): Accessibility 86, zero machine-detectable failed audits. The 14-point gap to 100 is Lighthouse's manual-check territory – judgment items that can't be automatically scored (logical focus order, plain language, link purpose in context). Performance 12 is a known Streamlit framework property: the Python→WebSocket architecture and large frontend bundle produce low Lighthouse Performance scores by design. Chasing a higher score would mean replacing the framework; the ceiling is accepted.
Built by Jonathan Nadeau.
Live app · GitHub source · nadeau.jonny@gmail.com · linkedin.com/in/nadeau-jonathan